5. Widgets
5.1. Introduction
The configuration of each widget is present in config_customer.yaml.
5.1.1. Type
The type specifies the kind of widget, e.g. barchart, geomap or wordcloud.
5.1.2. Title
The title is mandatory for a widget, while a subtitle is optional.
5.1.3. Options
The options map provides static configuration of the widget, e.g.:
options:
  chartjs:
    scales:
      { "y": { "min": 0, "max": 10000, "ticks": { "stepSize": 2000 } } }
  colors: ["#2daf4a", "#9662ec", "#4c7094"]
The example shows options for a linechart, where the y-axis is fixed from 0 to 10000 in steps of 2000. Also, the provided colors are used for the chart instead of the default linechart colors.
For some widgets, e.g. the markdown widget, the content is provided in the options:
options:
  content:
    markdown: |
      Some **bold** and *italic* text
5.1.4. Data
The data map specifies how to get dynamic content from a backend app, e.g.:
data:
  sources:
    - app: patient_explorer
      table: SIMMS_VERD
      filters:
        - reference_date
  transformations:
    data:
      - table(0)
      - columns(4)
    labels:
      - table(0)
      - column(1)
The example shows that data is fetched from an app called patient_explorer (defined in the APPS section of the configuration) and the table SIMMS_VERD is fetched from this app using the filter reference_date. The resulting data is transformed from the original table to a format that is required by the widget. In this example the barchart widget is used which requires data and labels.
See Transformations for more information.
5.1.5. Actions
The actions map specifies what action to take when a user clicks on a certain part of the widget.
actions:
  click:
    - match:
        datasetLabel: "Previous"
        elementLabel: "April"
      uri: "#/table/patients/dataset-previous-element-april"
    - match:
        datasetLabel: "Previous"
      uri: "#/table/patients/dataset-previous"
    - uri: "#/table/patients/wildcard"
The click list is traversed from top to bottom. If there is a match, that action is taken directly without looking at actions below it. The example shows that if the user clicks on element April in dataset Previous, the user is redirected to the specified location. At the bottom a catch-all location is configured.
The items to match on depend on the type of widget. Most widgets have elementIndex and elementLabel. For widgets that may have multiple datasets, e.g. barcharts and linecharts, there are also datasetIndex and datasetLabel. The sankey widget has fromKey, fromLabel, toKey and toLabel.
5.1.6. Number formatting
Most widgets show numbers, e.g. on an axis, on an element or in a tooltip. By default, these numbers are formatted for the current locale using the following settings:
{
  "numbers": {
    "abbreviate": false,
    "decimals": -1,
    "grouping": true,
    "postfix": "",
    "prefix": "",
    "significant": -1
  }
}
These can be changed on a per-widget basis to get other formatting:
Settings |
Data |
Formatted |
Remarks |
|---|---|---|---|
Default |
12345.67 |
12.345,67 |
|
{ abbreviate: true } |
12345.67 |
12,3 K |
Other settings have no effect when abbreviate is true |
{ decimals: 3 } |
12345.67 |
12.345,670 |
|
{ grouping: false } |
12345.67 |
12345,67 |
|
{ postfix: “ %” } |
12345.67 |
12.345,67 % |
|
{ prefix: “€ “ } |
12345.67 |
€ 12.345,67 |
|
{ significant: 6 } |
12345.67 |
12.345,7 |
|
{ decimals: 1, grouping: false } |
12345.67 |
12345,7 |
|
{ grouping: false, significant: 6 } |
12345.67 |
12345,7 |
|
{ decimals: 4, significant: 6 } |
12345.67 |
12.345,7 |
Significant takes precedence over decimals |
5.2. Areachart
Options:
{
  "chartjs": {},
  "colors": ["#4c7094", "#ecca62", "#94c11c", "#6aa5c6", "#af512d", "#2daf4a", "#9662ec", "#9a812d", "#3e3d70", "#4e5743"],
  "numbers": {
    "abbreviate": false,
    "decimals": -1,
    "grouping": true,
    "postfix": "",
    "prefix": "",
    "significant": -1
  }
}
5.2.1. Example 1
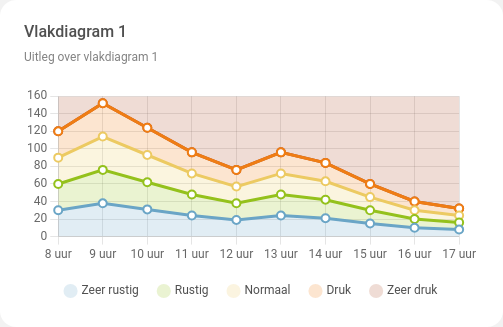
Configuration:
options:
  colors:
    - "#6aa5c6"
    - "#94c11c"
    - "#ecca62"
    - "#ef7d14"
    - "#af512d"
Input data:
{
  "data": [
    [30, 38, 31, 24, 19, 24, 21, 15, 10, 8],
    [60, 76, 62, 48, 38, 48, 42, 30, 20, 16],
    [90, 114, 93, 72, 57, 72, 63, 45, 30, 24],
    [120, 152, 124, 96, 76, 96, 84, 60, 40, 32],
  ],
  "labels": [
    "8 uur",
    "9 uur",
    "10 uur",
    "11 uur",
    "12 uur",
    "13 uur",
    "14 uur",
    "15 uur",
    "16 uur",
    "17 uur",
  ],
  "legends": ["Zeer rustig", "Rustig", "Normaal", "Druk", "Zeer druk"]
}
5.2.2. Example 2
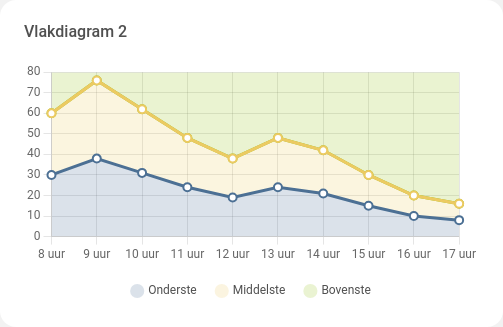
Configuration:
default
Input data:
{
  "data": [
    [30, 38, 31, 24, 19, 24, 21, 15, 10, 8],
    [60, 76, 62, 48, 38, 48, 42, 30, 20, 16],
  ],
  "labels": [
    "8 uur",
    "9 uur",
    "10 uur",
    "11 uur",
    "12 uur",
    "13 uur",
    "14 uur",
    "15 uur",
    "16 uur",
    "17 uur",
  ],
  "legends": ["Onderste", "Middelste", "Bovenste"]
}
5.3. Barchart
Options:
{
  "arrangement": "clustered", // clustered, stacked
  "benchmark": {}, // color=..., value=...
  "chartjs": {},
  "colors": ["#4c7094", "#ecca62", "#94c11c", "#6aa5c6", "#af512d", "#2daf4a", "#9662ec", "#9a812d", "#3e3d70", "#4e5743"],
  "numbers": {
    "abbreviate": false,
    "decimals": -1,
    "grouping": true,
    "postfix": "",
    "prefix": "",
    "significant": -1
  },
  "orientation": "vertical", // horizontal, vertical
}
5.3.1. Example 1
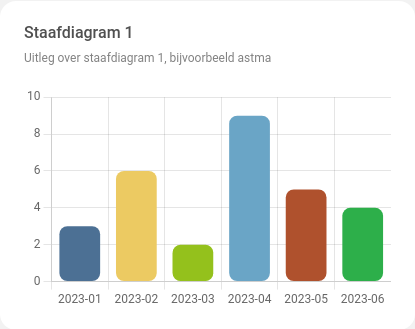
Configuration:
default
Input data:
{
  "data": [
    [3, 6, 2, 9, 5, 4]
  ],
  "labels": ["2023-01", "2023-02", "2023-03", "2023-04", "2023-05", "2023-06"]
}
5.3.2. Example 2
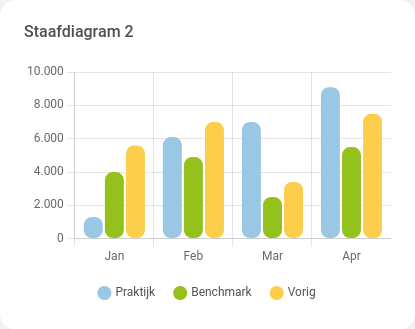
Configuration:
default
Input data:
{
  "data": [
    [1300, 6100, 7000, 9100],
    [4000, 4900, 2500, 5500],
    [5600, 7000, 3400, 7500],
  ],
  "labels": ["Jan", "Feb", "Mar", "Apr"],
  "legends": ["Praktijk", "Benchmark", "Vorig"]
}
5.3.3. Example 3
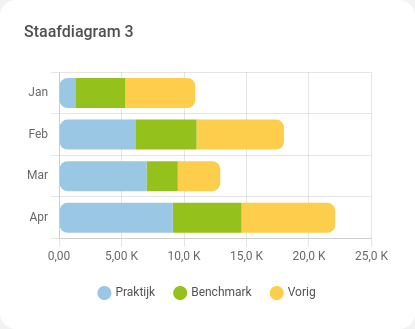
Configuration:
options:
  arrangement: stacked
  numbers:
    abbreviate: true
  orientation: horizontal
Input data:
see example 2
5.4. Barlinechart
Options:
{
  "chartjs": {},
  "colors": {
    "bar": ["#4c7094"],
    "line": "#ecca62"
  },
  "numbers": {
    "abbreviate": false,
    "decimals": -1,
    "grouping": true,
    "postfix": "",
    "prefix": "",
    "significant": -1
  }
}
5.4.1. Example 1
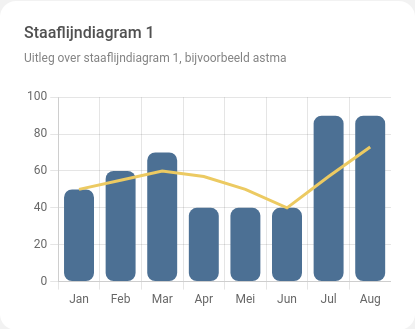
Configuration:
default
Input data:
{
  "bar": [50, 60, 70, 40, 40, 40, 90, 90],
  "line": [50, 55, 60, 57, 50, 40, 57, 73],
  "labels": ["Jan", "Feb", "Mar", "Apr", "Mei", "Jun", "Jul", "Aug"],
}
5.4.2. Example 2
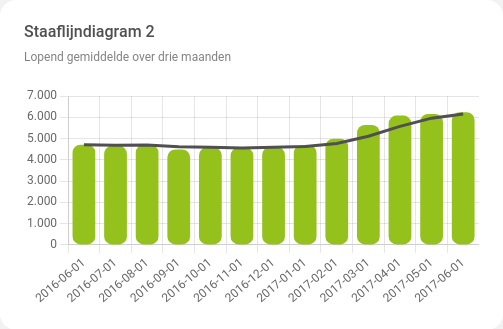
Configuration:
{
  "colors": {
    "bar": ["#94c11c"]
    "line": "#505050"
  }
}
Input data:
{
  "bar": [4719, 4663, 4714, 4495, 4592, 4582, 4612, 4705, 4998, 5649, 6087, 6163, 6249],
  "line": [4719, 4691, 4698.67, 4624, 4600.33, 4556.33, 4595.33, 4633, 4771.67, 5117.33, 5578, 5966.33, 6166.33],
  "labels": ["2016-06-01", "2016-07-01", "2016-08-01", "2016-09-01", "2016-10-01", "2016-11-01", "2016-12-01", "2017-01-01", "2017-02-01", "2017-03-01", "2017-04-01", "2017-05-01", "2017-06-01"]
}
5.4.3. Example 3
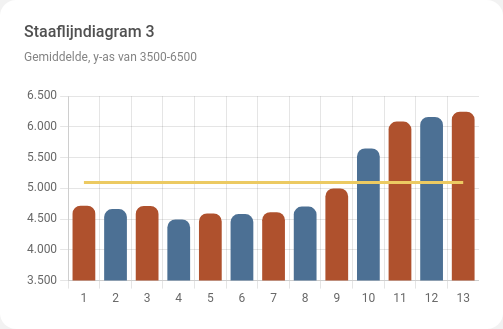
Configuration:
{
  "colors": {
    "bar": ["#af512d", "#4c7094"]
    "line": "#ecca62"
  }
}
Input data:
{
  "bar": [4719, 4663, 4714, 4495, 4592, 4582, 4612, 4705, 4998, 5649, 6087, 6163, 6249],
  "line": [5094.46, 5094.46, 5094.46, 5094.46, 5094.46, 5094.46, 5094.46, 5094.46, 5094.46, 5094.46, 5094.46, 5094.46, 5094.46],
  "labels": [1, 2, 3, 4, 5, 6, 7, 8, 9, 10, 11, 12, 13]
}
5.5. Doughnutchart
Options:
{
  "chartjs": {},
  "colors": ["#4c7094", "#ecca62", "#94c11c", "#6aa5c6", "#af512d", "#2daf4a", "#9662ec", "#9a812d", "#3e3d70", "#4e5743"],
  "numbers": {
    "abbreviate": false,
    "decimals": -1,
    "grouping": true,
    "postfix": "",
    "prefix": "",
    "significant": -1
  },
}
5.5.1. Example 1
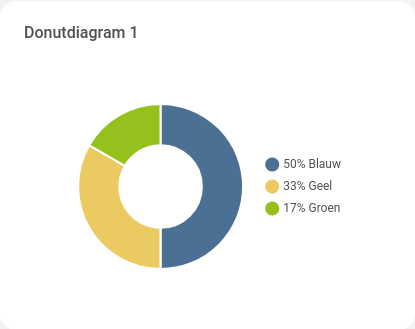
Configuration:
default
Input data:
{
  "data": [90, 60, 30],
  "labels": ["Blauw", "Geel", "Groen"]
}
5.6. Feedbacklist
Options:
{
  "colors": [
    { "below": 6, "background": "#eb4c56", "color": "#ffffff" },
    { "below": 8, "background": "#f4a35a", "color": "#333333" },
    { "below": 9, "background": "#fcce4c", "color": "#333333" },
    { "below": 1e100, "background": "#4c9dd0", "color": "#ffffff" }
  ],
  "numbers": {
    "abbreviate": false,
    "decimals": -1,
    "grouping": false,
    "postfix": "",
    "prefix": "",
    "significant": 2
  }
}
5.6.1. Example 1

Configuration:
default
Input data:
{
  "grades": [9.4, 8.1, 6.3],
  "names": ["Martine Slechteren", "Bas de Goede", "Anoniem"],
  "texts": ["Bekwaam en deskundig. Duidelijke uitleg.", "Was gewoon goed", "Vond de communicatie niet zo goed."],
  "tops": ["Gaat super!", "Goed bezig", ""],
  "tips": ["Geen verbeterpunten", "", "Beter communiceren"]
}
5.7. Gauge
Options:
{
  "colors": {
    "above": "#2daf4a",
    "below": "#ef7d14"
  },
  "numbers": {
    "abbreviate": false,
    "decimals": -1,
    "grouping": true,
    "postfix": "",
    "prefix": "",
    "significant": -1
  },
  "range": {
    "max": 100,
    "min": 0
  }
}
5.7.1. Example 1
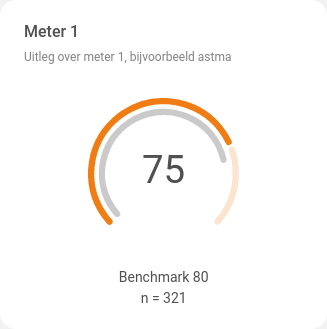
Configuration:
default
Input data:
{
  "benchmark": 80,
  "value": 75,
  "text1": "Benchmark 80",
  "text2": "n = 321"
}
5.7.2. Example 2
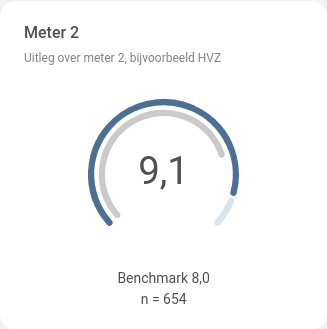
Configuration:
options:
  colors:
    above: "#4c7094"
    below: "#ef7d14"
  range:
    max: 10
    min: 1
Input data:
{
  "benchmark": 8.0,
  "value": 9.1,
  "text1": "Benchmark 8,0",
  "text2": "n = 654"
}
5.8. Geomap
Options:
{
  "area": "Germany", // Europe, Germany, Netherlands
  "background": "#e8e8e8",
  "color": "#4c7094",
  "numbers": {
    "abbreviate": false,
    "decimals": -1,
    "grouping": true,
    "postfix": "",
    "prefix": "",
    "significant": -1
  },
  "places": []
}
5.8.1. Example 1
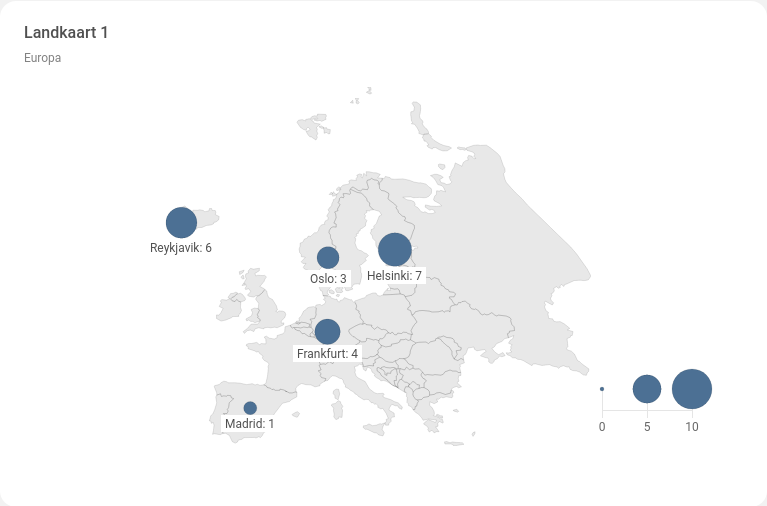
Configuration:
options:
  area: Europe
  places:
    - { "name": "Frankfurt", "lat": 50.110922, "lon": 8.682127 }
    - { "name": "Helsinki", "lat": 60.170457, "lon": 24.941647 }
    - { "name": "Madrid", "lat": 40.416775, "lon": -3.703790 }
    - { "name": "Oslo", "lat": 59.913868, "lon": 10.752245 }
    - { "name": "Reykjavik", "lat": 64.147210, "lon": -21.942400 }
Input data:
{
  "data": [4, 7, 1, 3, 6]
}
5.8.2. Example 2
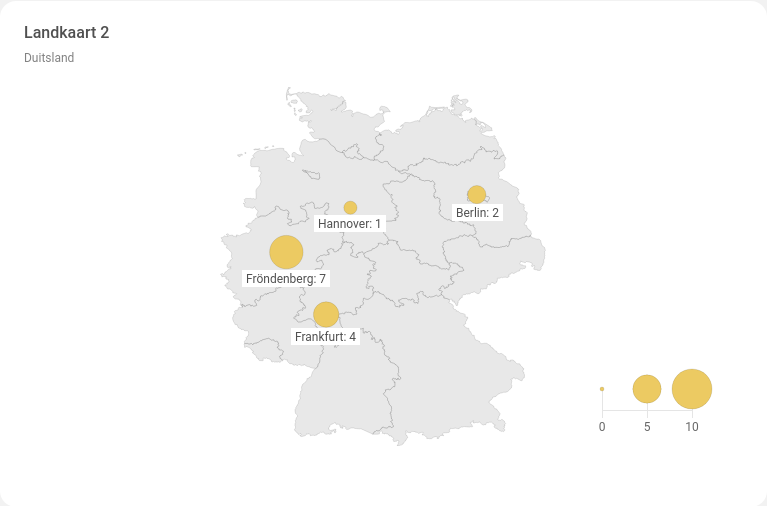
Configuration:
options:
  area: Germany
  color: "#ecca62"
  places:
    - { "name": "Berlin", "lat": 52.520007, "lon": 13.404954 }
    - { "name": "Frankfurt", "lat": 50.110922, "lon": 8.682127 }
    - { "name": "Fröndenberg", "lat": 51.473981, "lon": 7.768603 }
    - { "name": "Hannover", "lat": 52.375892, "lon": 9.732010 }
Input data:
{
  "data": [2, 4, 7, 1]
}
5.8.3. Example 3
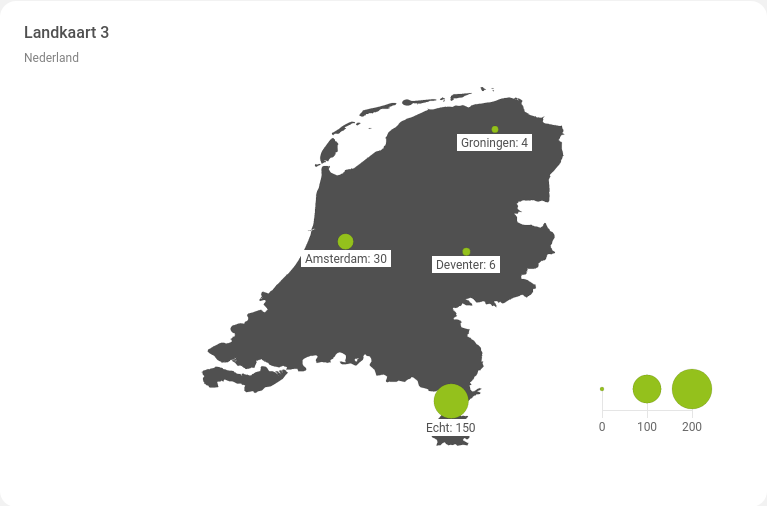
Configuration:
options:
  area: Netherlands
  background: "#505050"
  color: "#94c11c"
  places:
    - { "name": "Amsterdam", "lat": 52.367966, "lon": 4.913924 }
    - { "name": "Deventer", "lat": 52.266046, "lon": 6.155370 }
    - { "name": "Echt", "lat": 51.103279, "lon": 5.874581 }
    - { "name": "Groningen", "lat": 53.218740, "lon": 6.567399 }
Input data:
{
  "data": [30, 6, 150, 4]
}
5.9. Itemlist
Options:
{
  "colors": [
    { "below": 1, "background": "#94c11c", "color": "#ffffff" },
    { "below": 1000, "background": "#ef7d14", "color": "#ffffff" },
    { "below": 1e100, "background": "#af512d", "color": "#ffffff" },
  ],
  "items": []
}
5.9.1. Example 1
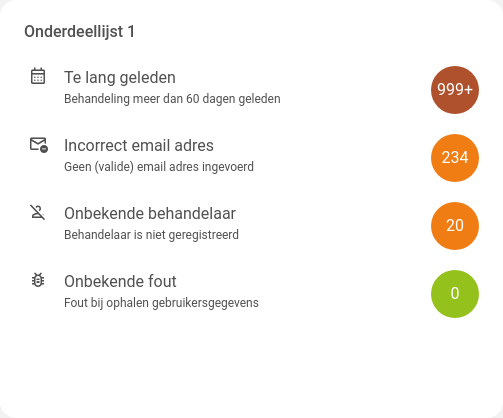
Configuration:
options:
  items:
    - { "icon": "calendar_month", "text1": "Te lang geleden", "text2": "Behandeling meer dan 60 dagen geleden" }
    - { "icon": "unsubscribe", "text1": "Incorrect email adres", "text2": "Geen (valide) email adres ingevoerd" }
    - { "icon": "person_off", "text1": "Onbekende behandelaar", "text2": "Behandelaar is niet geregistreerd" }
    - { "icon": "bug_report", "text1": "Onbekende fout", "text2": "Fout bij ophalen gebruikersgegevens" }
Input data:
{
  "data": [1000, 234, 20, 0]
}
5.10. Linechart
Options:
{
  "benchmark": {}, // color=..., value=...
  "chartjs": {},
  "colors": ["#4c7094", "#ecca62", "#94c11c", "#6aa5c6", "#af512d", "#2daf4a", "#9662ec", "#9a812d", "#3e3d70", "#4e5743"],
  "numbers": {
    "abbreviate": false,
    "decimals": -1,
    "grouping": true,
    "postfix": "",
    "prefix": "",
    "significant": -1
  }
}
5.10.1. Example 1
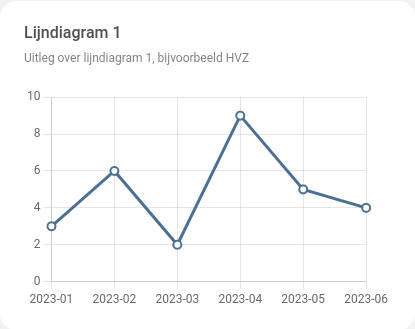
Configuration:
default
Input data:
{
  "data": [
    [3, 6, 2, 9, 5, 4]
  ],
  "labels": ["2023-01", "2023-02", "2023-03", "2023-04", "2023-05", "2023-06"]
}
5.10.2. Example 2
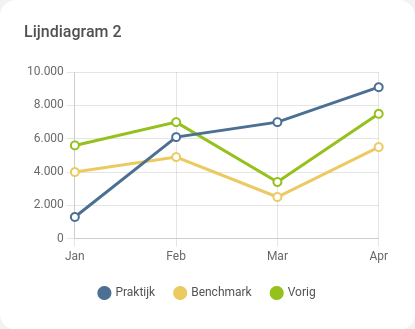
Configuration:
default
Input data:
{
  "data": [
    [1300, 6100, 7000, 9100],
    [4000, 4900, 2500, 5500],
    [5600, 7000, 3400, 7500],
  ],
  "labels": ["Jan", "Feb", "Mar", "Apr"],
  "legends": ["Praktijk", "Benchmark", "Vorig"]
}
5.10.3. Example 3
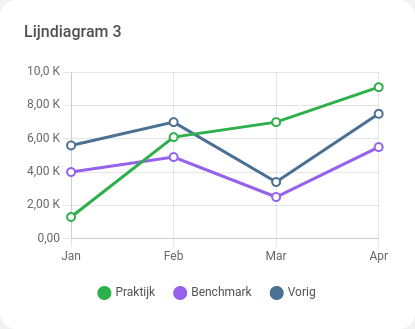
Configuration:
options:
  colors: ["#2daf4a", "#9662ec", "#4c7094"]
  numbers:
    abbreviate: true
Input data:
see example 2
5.10.4. Example 4
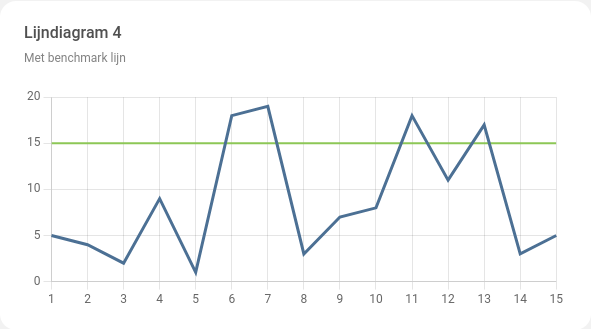
Configuration:
options:
  benchmark:
    color: "#8dc756"
    value: 15
  chartjs:
    pointRadius: 0
Input data:
{
  "data": [
    [5, 4, 2, 9, 1, 18, 19, 3, 7, 8, 18, 11, 17, 3, 5]
  ],
  "labels": [1, 2, 3, 4, 5, 6, 7, 8, 9, 10, 11, 12, 13, 14, 15]
}
5.11. Linklist
Options:
{
  "content": []
}
5.11.1. Example 1
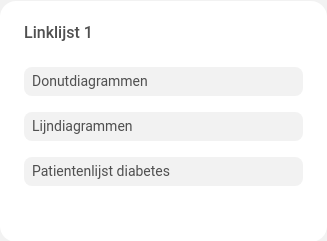
Configuration:
options:
  content:
    - { "title": "Donutdiagrammen", "url": "#/dashboard/dashboard_doughnutcharts" }
    - { "title": "Lijndiagrammen", "url": "#/dashboard/dashboard_linecharts" }
    - { "title": "Patiëntenlijst diabetes", "url": "#/table/explorer_patient/PATIENT_OVERVIEW_DIAB" }
Input data:
none
5.12. Markdown
Options:
{
   "content": "",
   "html": true,
   "linkify": true,
   "typographer": true
}
5.12.1. Example 1
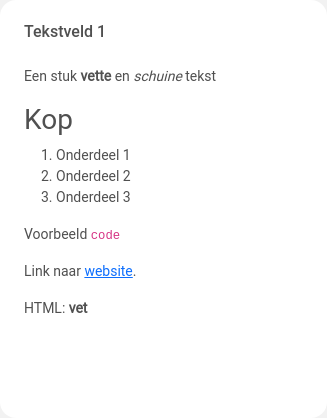
Configuration:
options:
  content: |
    Een stuk **vette** en *schuine* tekst

    ### Kop

    1. Onderdeel 1
    1. Onderdeel 2
    1. Onderdeel 3

    Voorbeeld `code`

    Link naar [website](https://mgrid.net).

    HTML: <b>vet</b>
Input data:
none
5.13. Progressbar
Options:
{
  "colors": [
    { "below": 25, "color": "#eb4c56" },
    { "below": 50, "color": "#f4a35a" },
    { "below": 75, "color": "#fcce4c" },
    { "below": 101, "color": "#4c9dd0" }
  ],
  "numbers": {
    "abbreviate": false,
    "decimals": -1,
    "grouping": true,
    "postfix": "",
    "prefix": "",
    "significant": -1
  }
}
5.13.1. Example 1
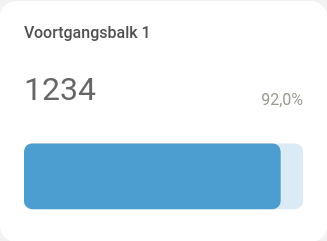
Configuration:
default
Input data:
{
  "value": 1234,
  "percentage": 92
}
5.13.2. Example 2
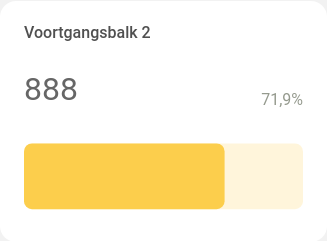
Configuration:
default
Input data:
{
  "value": 888,
  "percentage": 71.9
}
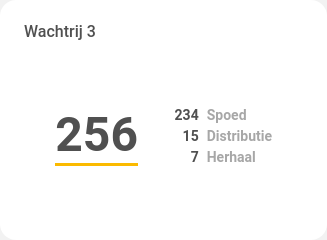
5.14. Queue
Options:
{
  "colors": [
    {
      "background": "white",
      "border": "white",
      "color": "#a7a7a7",
      "line": "white",
    },
    {
      "background": "white",
      "border": "white",
      "color": "#505050",
      "line": "white",
    },
    {
      "background": "white",
      "border": "white",
      "color": "#505050",
      "line": "#fbba00",
    },
    {
      "background": "#white",
      "border": "#af512d",
      "color": "#505050",
      "line": "#af512d",
    },
    {
      "background": "#fce5e6",
      "border": "#af512d",
      "color": "#505050",
      "line": "#af512d",
    },
  ],
  "numbers": {
    "abbreviate": false,
    "decimals": -1,
    "grouping": true,
    "postfix": "",
    "prefix": "",
    "significant": -1
  }
}
5.14.1. Example 1
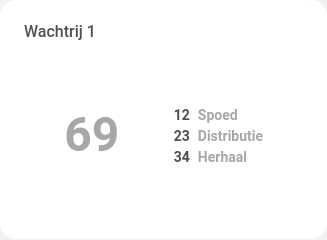
Configuration:
default
Input data:
{
  "data": [12, 23, 34],
  "labels": ["Spoed", "Distributie", "Herhaal"],
  "thresholds": [100, 200, 400, 800],
  "indicators": ["Heel rustig", "Rustig", "Normaal", "Druk", "Heel druk"]
}
5.14.2. Example 2
Configuration:
default
Input data:
{
  "data": [234, 15, 7],
  "labels": ["Spoed", "Distributie", "Herhaal"],
  "thresholds": [100, 200, 400, 800],
  "indicators": ["Heel rustig", "Rustig", "Normaal", "Druk", "Heel druk"]
}
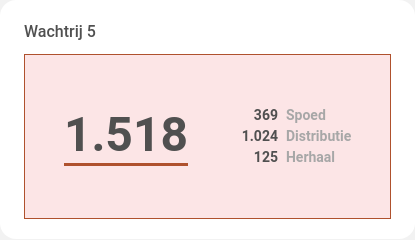
5.14.3. Example 3
Configuration:
default
Input data:
{
  "data": [369, 1024, 125],
  "labels": ["Spoed", "Distributie", "Herhaal"],
  "thresholds": [100, 200, 400, 800],
  "indicators": ["Heel rustig", "Rustig", "Normaal", "Druk", "Heel druk"]
}
5.15. Sankey
Options:
{
  "chartjs": {},
  "colors": ["#4c7094", "#ecca62", "#94c11c", "#6aa5c6", "#af512d", "#2daf4a", "#9662ec", "#9a812d", "#3e3d70", "#4e5743"],
  "links": [],
  "nodes": [],
  "numbers": {
    "abbreviate": false,
    "decimals": -1,
    "grouping": true,
    "postfix": "",
    "prefix": "",
    "significant": -1
  }
}
5.15.1. Example 1
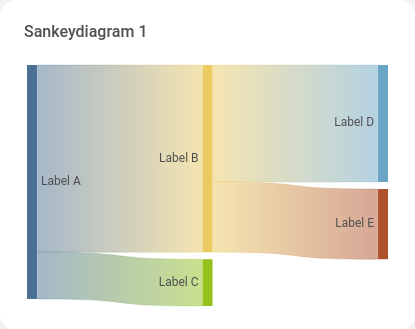
Configuration:
options:
  chartjs:
    column:
      "a": 0
      "b": 1
      "c": 1
      "d": 2
      "e": 2
    priority:
      "a": 1
      "b": 2
      "c": 3
      "d": 4
      "e": 5
  links:
    - { "from": "a", "to": "b" }
    - { "from": "a", "to": "c" }
    - { "from": "b", "to": "d" }
    - { "from": "b", "to": "e" }
  nodes:
    "a": "Label A"
    "b": "Label B"
    "c": "Label C"
    "d": "Label D"
    "e": "Label E"
Input data:
{
  "data": [80, 20, 50, 30]
}
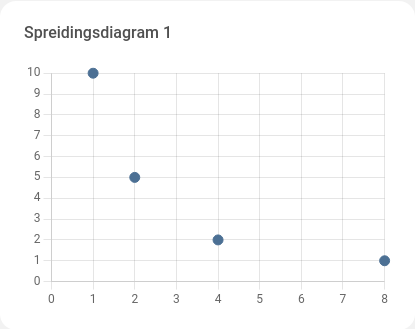
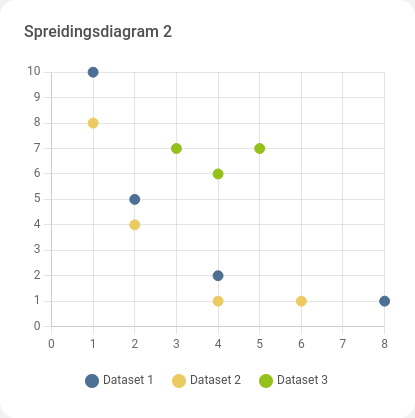
5.16. Scatterchart
Options:
{
  "chartjs": {},
  "colors": ["#4c7094", "#ecca62", "#94c11c", "#6aa5c6", "#af512d", "#2daf4a", "#9662ec", "#9a812d", "#3e3d70", "#4e5743"],
  "numbers": {
    "abbreviate": false,
    "decimals": -1,
    "grouping": true,
    "postfix": "",
    "prefix": "",
    "significant": -1
  }
}
5.16.1. Example 1
Configuration:
default
Input data:
{
  "x": [
    [1, 2, 4, 8]
  ],
  "y": [
    [10, 5, 2, 1]
  ]
}
5.16.2. Example 2
Configuration:
default
Input data:
{
  "x": [
    [1, 2, 4, 8],
    [1, 2, 4, 6],
    [3, 4, 5]
  ],
  "y": [
    [10, 5, 2, 1],
    [8, 4, 1, 1],
    [7, 6, 7]
  ],
  "legends": ["Dataset 1", "Dataset 2", "Dataset 3"]
}
5.16.3. Example 3
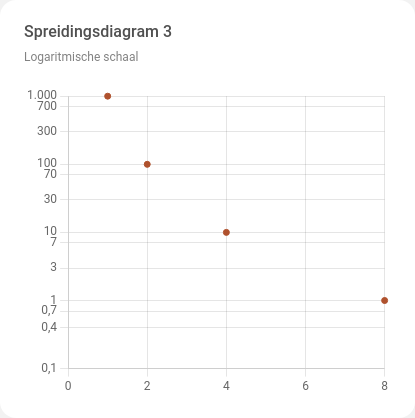
Configuration:
options:
  chartjs:
    scales: { "y": { "type": "logarithmic" } }
Input data:
{
  "x": [
    [1, 2, 4, 8]
  ],
  "y": [
    [1000, 100, 10, 1]
  ]
}
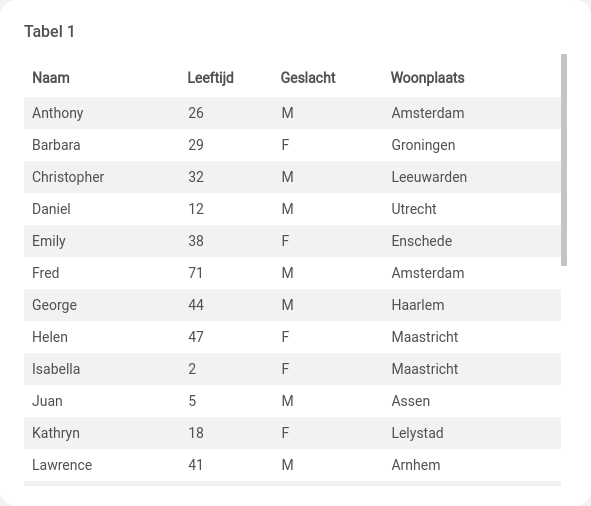
5.17. Table
Options:
{
  "style": {
    "default": {
      "align": "left",
      "background": "",
      "border": "",
      "color": "",
      "numbers": {
        "abbreviate": false,
        "decimals": -1,
        "grouping": true,
        "postfix": "",
        "prefix": "",
        "significant": -1
      },
      "width": ""
    }
  }
}
Style options can be set for the whole table under the default key or per header, column, row or cell under keys such as header, column_0, row_1 and column_0_row_1. More specific keys have higher priority, e.g. column_0_row_1 overrides style options specified in column_0 and row_1.
5.17.1. Example 1
Configuration:
default
Input data:
{
  "data": [
    ["Anthony", 26, "M", "Amsterdam"],
    ["Barbara", 29, "F", "Groningen"],
    ["Christopher", 32, "M", "Leeuwarden"],
    ["Daniel", 12, "M", "Utrecht"],
    ["Emily", 38, "F", "Enschede"],
    ["Fred", 71, "M", "Amsterdam"],
    ["George", 44, "M", "Haarlem"],
    ["Helen", 47, "F", "Maastricht"],
    ["Isabella", 2, "F", "Maastricht"],
    ["Juan", 5, "M", "Assen"],
    ["Kathryn", 18, "F", "Lelystad"],
    ["Lawrence", 41, "M", "Arnhem"],
    ["Marilyn", 14, "F", "Den Haag"],
    ["Nathan", 37, "M", "Middelburg"],
    ["Oliver", 20, "M", "Den Bosch"],
    ["Patricia", 23, "F", "Zwolle"],
    ["Quentin", 50, "M", "Den Bosch"],
    ["Robert", 53, "M", "Leeuwarden"],
    ["Samantha", 59, "F", "Groningen"],
    ["Tyler", 59, "M", "Haarlem"],
    ["Uma", 22, "F", "Middelburg"],
    ["Virginia", 65, "F", "Maastricht"],
    ["William", 8, "M", "Assen"],
    ["Xandra", 71, "F", "Groningen"],
    ["Yasmin", 71, "F", "Maastricht"],
    ["Zoe", 91, "F", "Maastricht"]
  ],
  "header": ["Naam", "Leeftijd", "Geslacht", "Woonplaats"]
}
5.17.2. Example 2
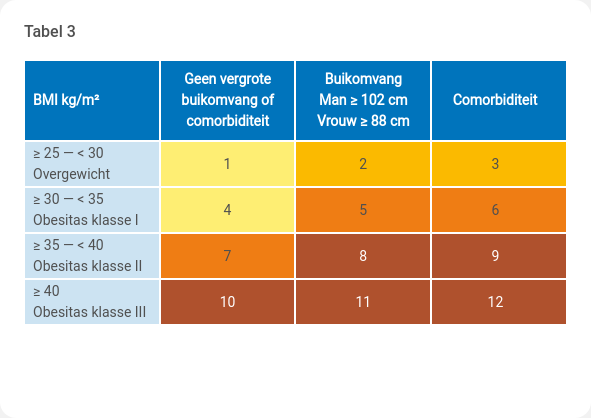
Configuration:
{
  "style":
    "default":
      "border": "white"
    "header":
      "background": "#0074BC"
      "color": "white"
    "column_0":
      "background": "#CCE3F2"
      "width": "25%"
    "column_1":
      "align": "center"
      "width": "25%"
     "column_2":
      "align": "center"
      "width": "25%"
     "column_3":
      "align": "center"
      "width": "25%"
     "column_1_row_0":
       "background": "#FEEE73"
     "column_1_row_1":
       "background": "#FEEE73"
     "column_1_row_2":
       "background": "#EF7D14"
     "column_1_row_3":
       "background": "#AF512D"
       "color": "white"
     "column_2_row_0":
       "background": "#FBBA00"
     "column_2_row_1":
       "background": "#EF7D14"
     "column_2_row_2":
       "background": "#AF512D"
       "color": "white"
     "column_2_row_3":
       "background": "#AF512D"
       "color": "white"
     "column_3_row_0":
       "background": "#FBBA00"
     "column_3_row_1":
       "background": "#EF7D14"
     "column_3_row_2":
       "background": "#AF512D"
       "color": "white"
     "column_3_row_3":
       "background": "#AF512D"
       "color": "white"
}
Input data:
{
  "data": [
    [1, 2, 3],
    [4, 5, 6],
    [7, 8, 9],
    [10, 11, 12]
  ],
  "header": [
    "BMI kg/m²",
    "Geen vergrote\nbuikomvang of\ncomorbiditeit",
    "Buikomvang\nMan ≥ 102 cm\nVrouw ≥ 88 cm",
    "Comorbiditeit"
  ],
  "labels": [
    "≥ 25 — < 30\nOvergewicht",
    "≥ 30 — < 35\nObesitas klasse I",
    "≥ 35 — < 40\nObesitas klasse II",
    "≥ 40\nObesitas klasse III"
  ]
}
5.18. Topbars
Options:
{
  "chartjs": {},
  "colors": ["#4c7094", "#ecca62", "#94c11c", "#6aa5c6", "#af512d", "#2daf4a", "#9662ec", "#9a812d", "#3e3d70", "#4e5743"],
  "numbers": {
    "abbreviate": false,
    "decimals": -1,
    "grouping": true,
    "postfix": "",
    "prefix": "",
    "significant": -1
  }
}
5.18.1. Example 1
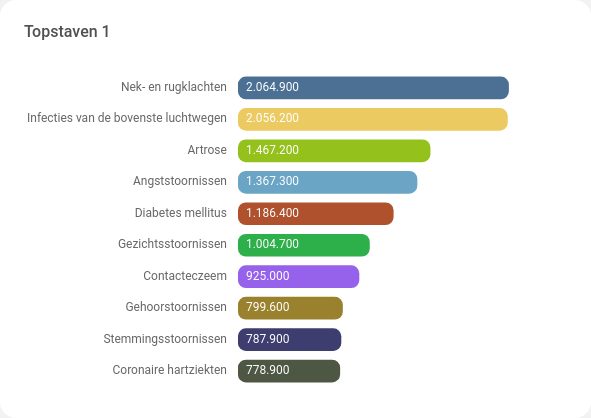
Configuration:
default
Input data:
{
  "data": [2064900, 2056200, 1467200, 1367300, 1186400, 1004700, 925000, 799600, 787900, 778900],
  "labels": ["Nek- en rugklachten", "Infecties van de bovenste luchtwegen", "Artrose", "Angststoornissen", "Diabetes mellitus", "Gezichtsstoornissen", "Contacteczeem", "Gehoorstoornissen", "Stemmingsstoornissen", "Coronaire hartziekten"]
}
5.18.2. Example 2
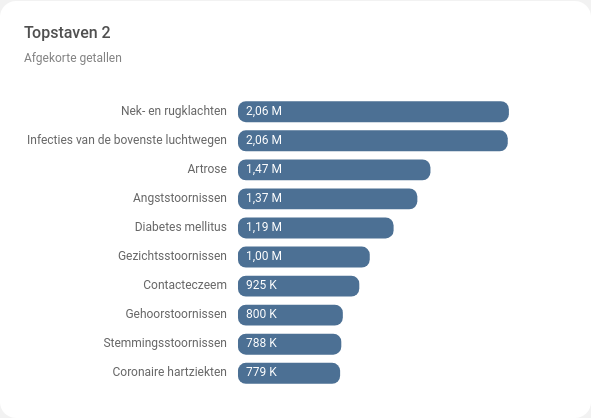
Configuration:
options:
  colors: ["4c7094"]
  numbers:
    abbreviate: true
Input data:
see example 1
5.19. Treemap
Options:
{
  "chartjs": {},
  "color": "#0074bc",
  "numbers": {
    "abbreviate": false,
    "decimals": -1,
    "grouping": true,
    "postfix": "",
    "prefix": "",
    "significant": -1
  }
}
5.19.1. Example 1
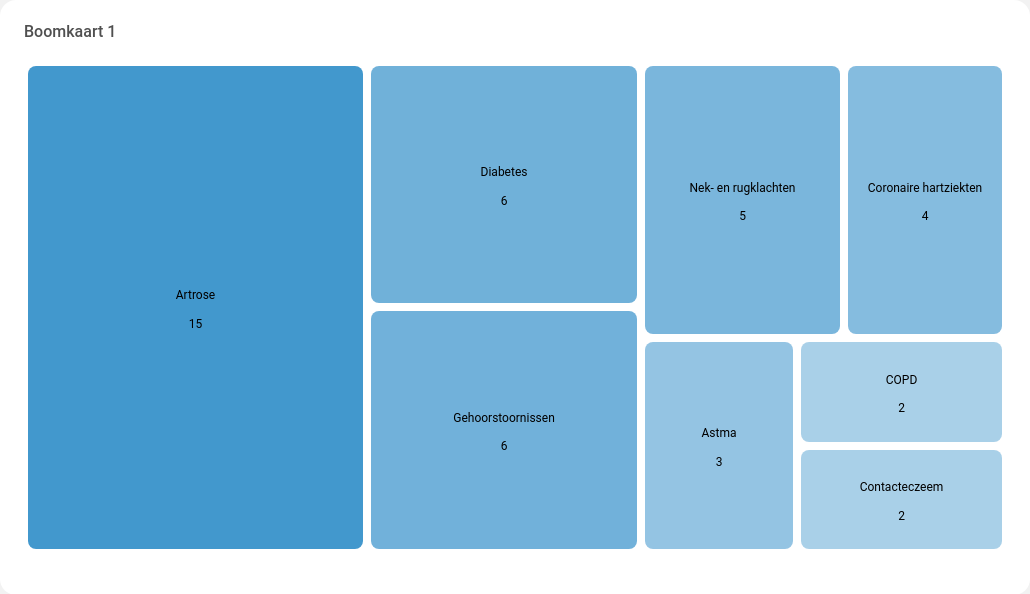
Configuration:
default
Input data:
{
  "data": [15, 6, 6, 5, 4, 3, 2, 2],
  "labels": ["Artrose", "Diabetes", "Gehoorstoornissen", "Nek- en rugklachten", "Coronaire hartziekten", "Astma", "COPD", "Contacteczeem"]
}
5.19.2. Example 2
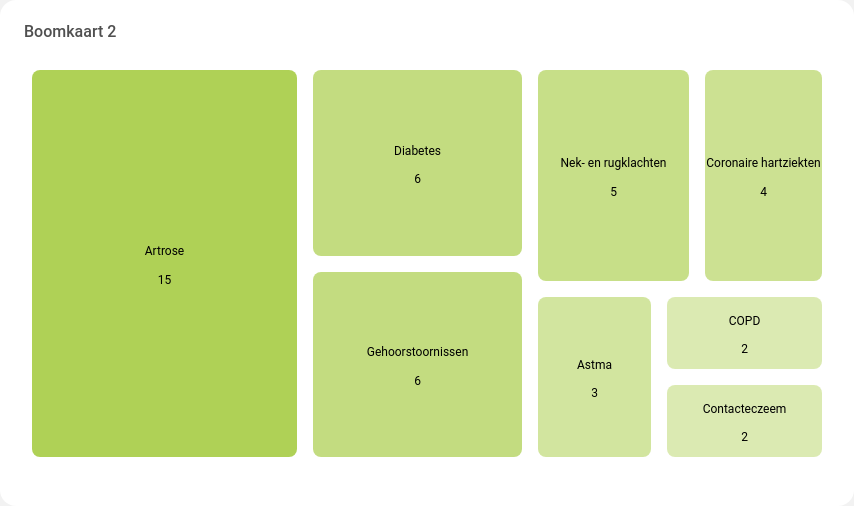
Configuration:
options:
  color: "#94c11c"
  chartjs:
    spacing: 8
Input data:
see example 1
5.20. Value
Options:
{
  "bold": false,
  "color": "#000000",
  "italic": false,
  "numbers": {
    "abbreviate": false,
    "decimals": -1,
    "grouping": true,
    "postfix": "",
    "prefix": "",
    "significant": -1
  },
  "size": "24",
  "underline": false
}
5.20.1. Example 1
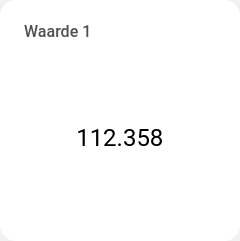
Configuration:
default
Input data:
{
  "data": 112358
}
5.20.2. Example 2
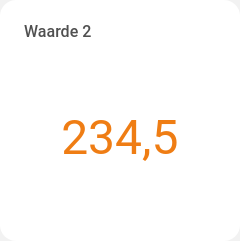
Configuration:
options:
  color: "#ef7d14"
  size: 48
Input data:
{
  "data": 234.5
}
5.21. Valuelist
Options:
{
  "numbers": {
    "abbreviate": false,
    "decimals": -1,
    "grouping": true,
    "postfix": "",
    "prefix": "",
    "significant": -1
  }
}
5.21.1. Example 1
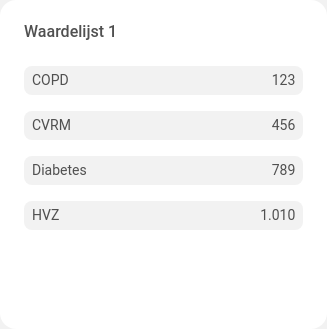
Configuration:
default
Input data:
{
  "labels": ["COPD", "CVRM", "Diabetes", "HVZ"],
  "values": [123, 456, 789, 1010]
}
5.22. Venndiagram
Options:
{
  "colors": ["#99adc2", "#99adc2", "#99adc2", "#4c7094", "#4c7094", "#4c7094", "#003366"],
  "numbers": {
    "abbreviate": false,
    "decimals": -1,
    "grouping": true,
    "postfix": "",
    "prefix": "",
    "significant": -1
  },
}
5.22.1. Example 1
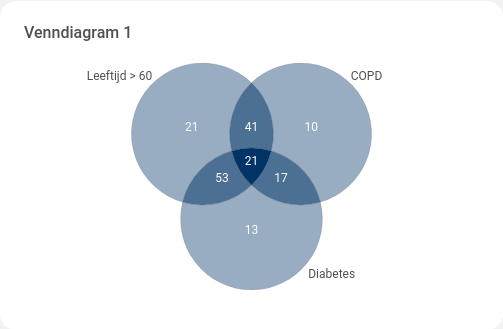
Configuration:
default
Input data:
{
  "data": [21, 10, 13, 41, 53, 17, 21],
  "labels": ["Leeftijd > 60", "COPD", "Diabetes"]
}
5.22.2. Example 2
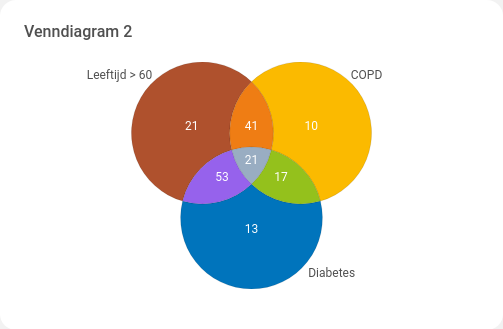
Configuration:
options:
  colors: ["#af512d", "#fbba00", "#0074bc", "#ef7d14", "#9662ec", "#94c11c", "#99adc2"]
Input data:
see example 1
5.23. Wordcloud
Options:
{
  "colors": ["#4c7094", "#ecca62", "#94c11c", "#6aa5c6", "#af512d", "#2daf4a", "#9662ec", "#9a812d", "#3e3d70", "#4e5743"],
  "font": {
    "max": 60,
    "min": 14
  },
  "numbers": {
    "abbreviate": false,
    "decimals": -1,
    "grouping": true,
    "postfix": "",
    "prefix": "",
    "significant": -1
  }
}
5.23.1. Example 1
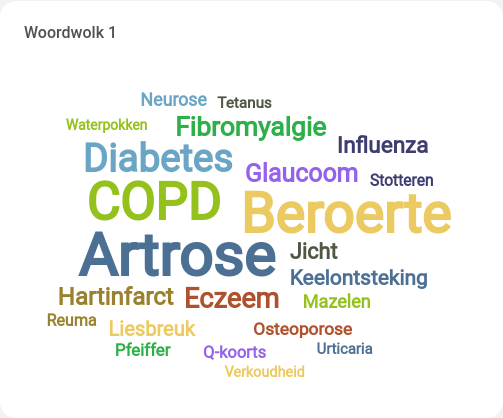
Configuration:
default
Input data:
{
  "data": [12012, 10876, 9876, 6745, 4023, 3834, 3445, 3256, 2867, 2678, 2489, 2290, 1801, 1712, 1623, 1500, 1400, 1300, 1200, 1100, 1000, 900, 800],
  "labels": ["Artrose", "Beroerte", "COPD", "Diabetes", "Eczeem", "Fibromyalgie", "Glaucoom", "Hartinfarct", "Influenza", "Jicht", "Keelontsteking", "Liesbreuk", "Mazelen", "Neurose", "Osteoporose", "Pfeiffer", "Q-koorts", "Reuma", "Stotteren", "Tetanus", "Urticaria", "Verkoudheid", "Waterpokken"]
}
5.23.2. Example 2
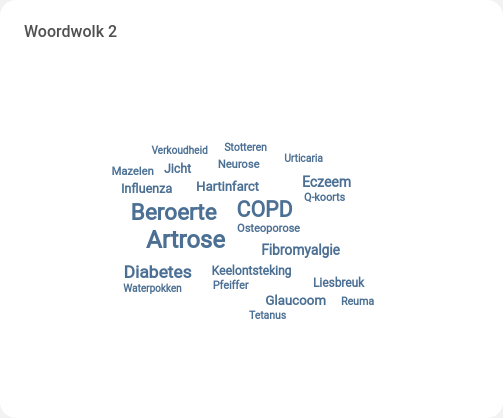
Configuration:
options:
  colors: ["#4c7094"]
  font:
    max: 24
    min: 10
Input data:
see example 1