class: center, middle .logo[] # BI Explorer Product Tour Swipe to switch between slides on mobile devices. Use the arrow keys and home/end on devices with a keyboard. © MGRID 2019. All rights reserved --- class: middle ### Introduction This product tour shows how the BI Explorer helps to get quick insight into medical data. The next slides will show a medical professional: * use the dashboard to get a broad overview into population, process and outcomes * drill down to the data underlying the graphs * use the powerful filtering, grouping and pivot features to create new insights * save helpful configurations as presets for future shared use --- class: center, middle ### Overall dashboard  --- class: center, middle ### Diabetes Population  --- class: center, middle ### Diabetes Process  --- class: center, middle ### Diabetes Outcomes  --- class: center, middle ### Diabetes Patient List 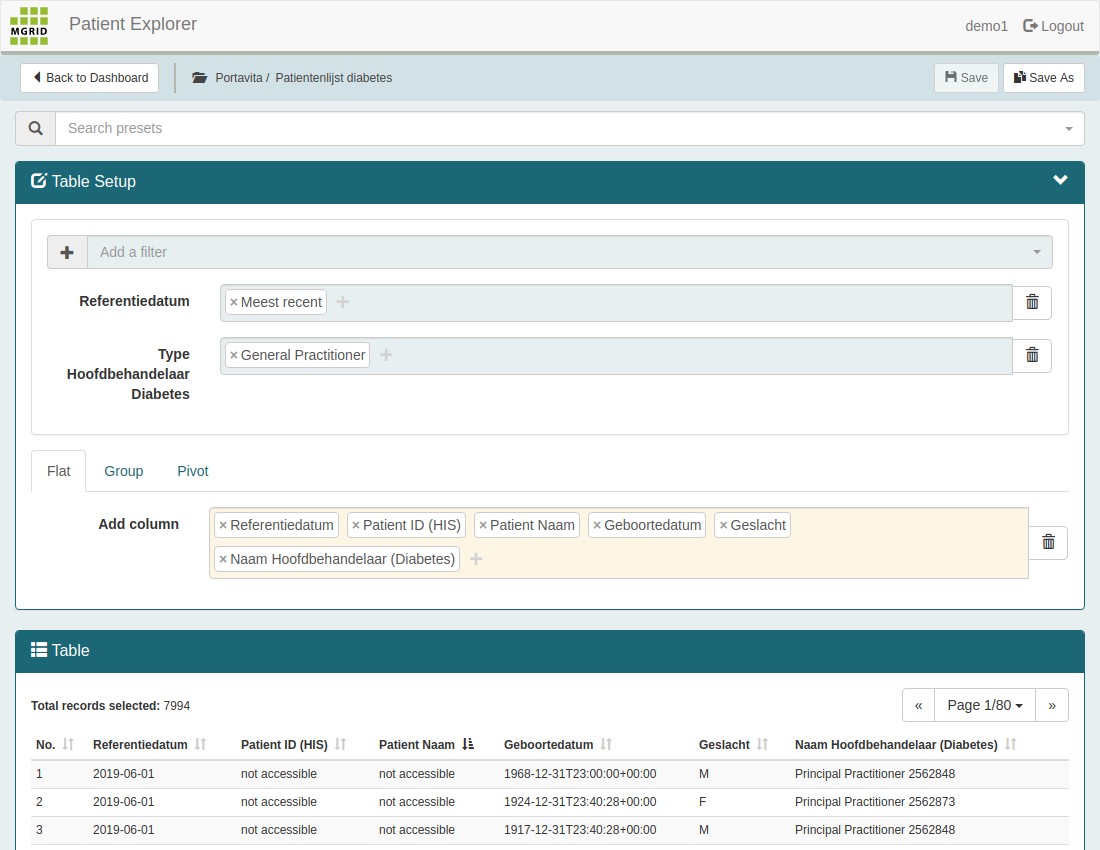 --- class: center, middle ### Add Data Item (1/2) 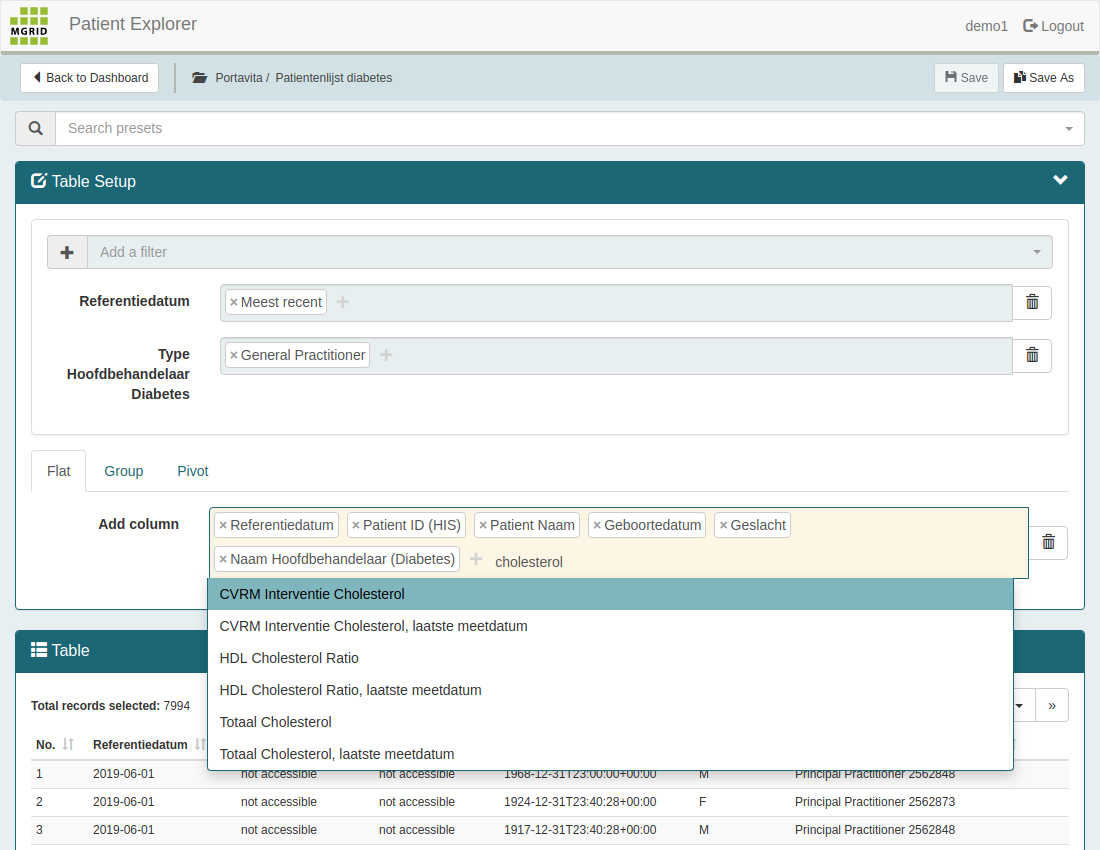 --- class: center, middle ### Add Data Item (2/2) 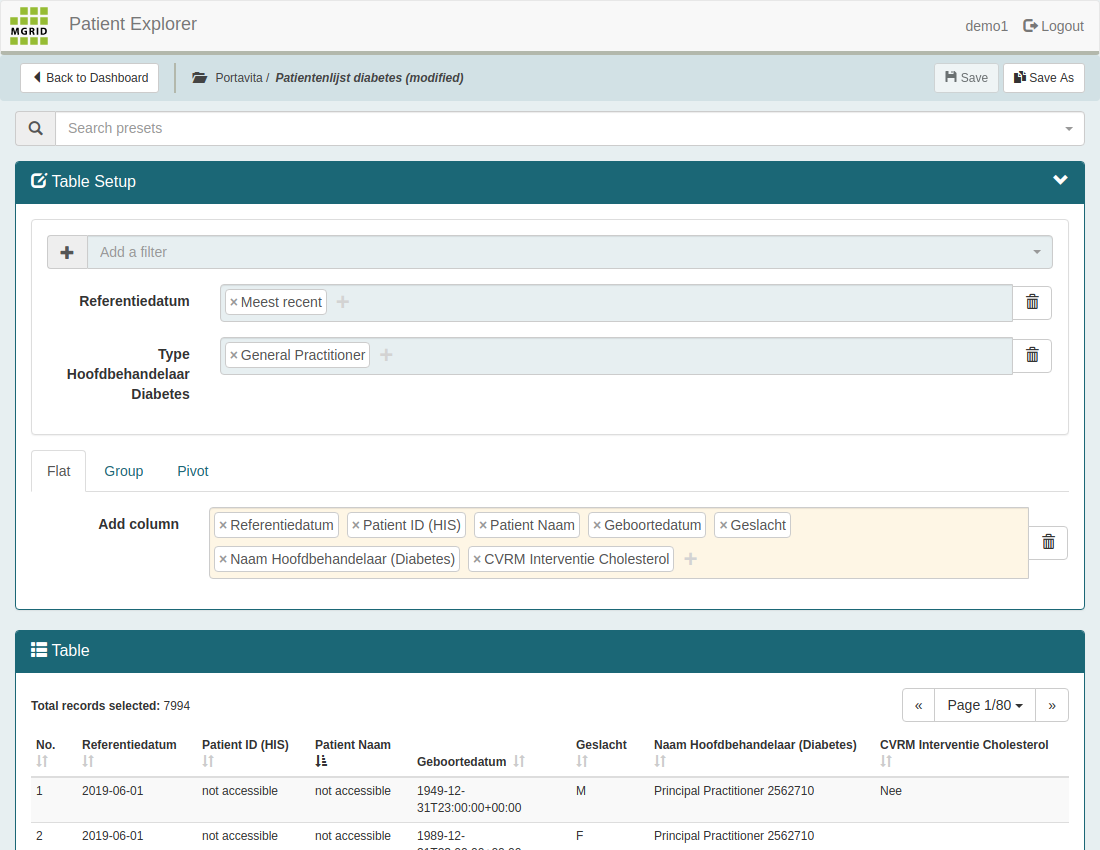 --- class: center, middle ### Add Filter (1/3) 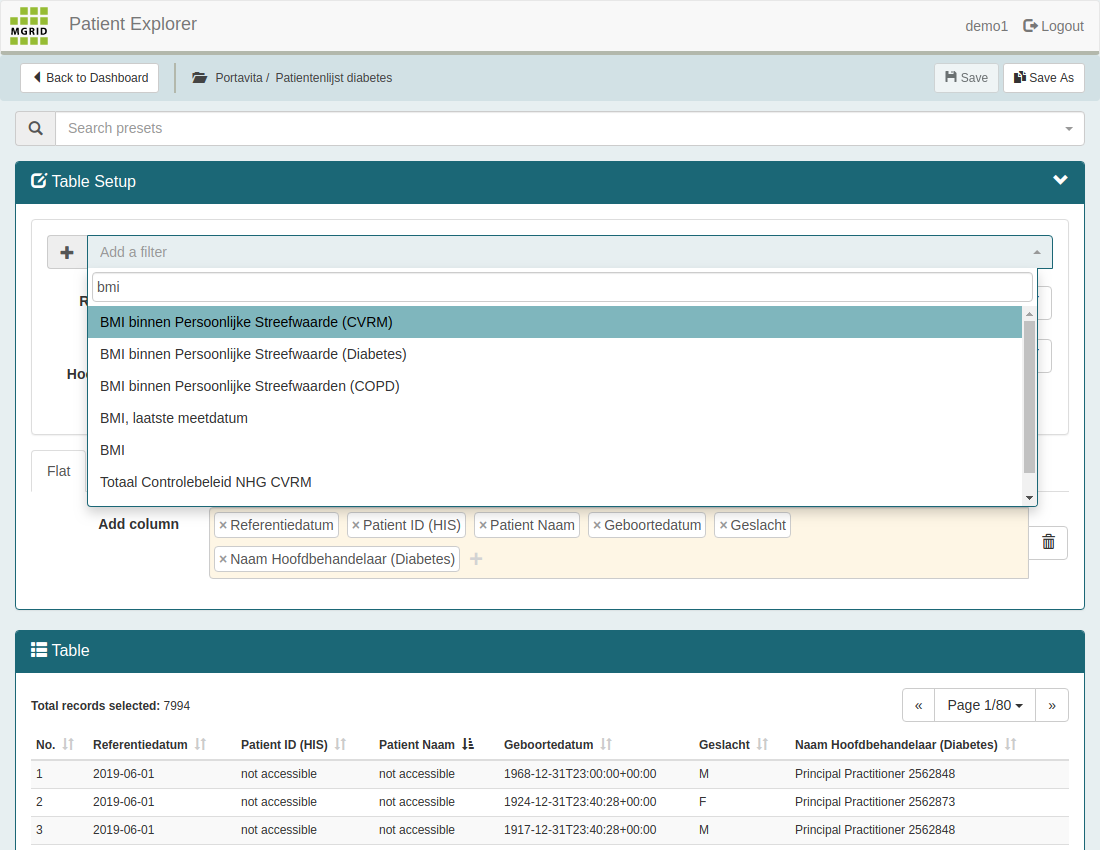 --- class: center, middle ### Add Filter (2/3) 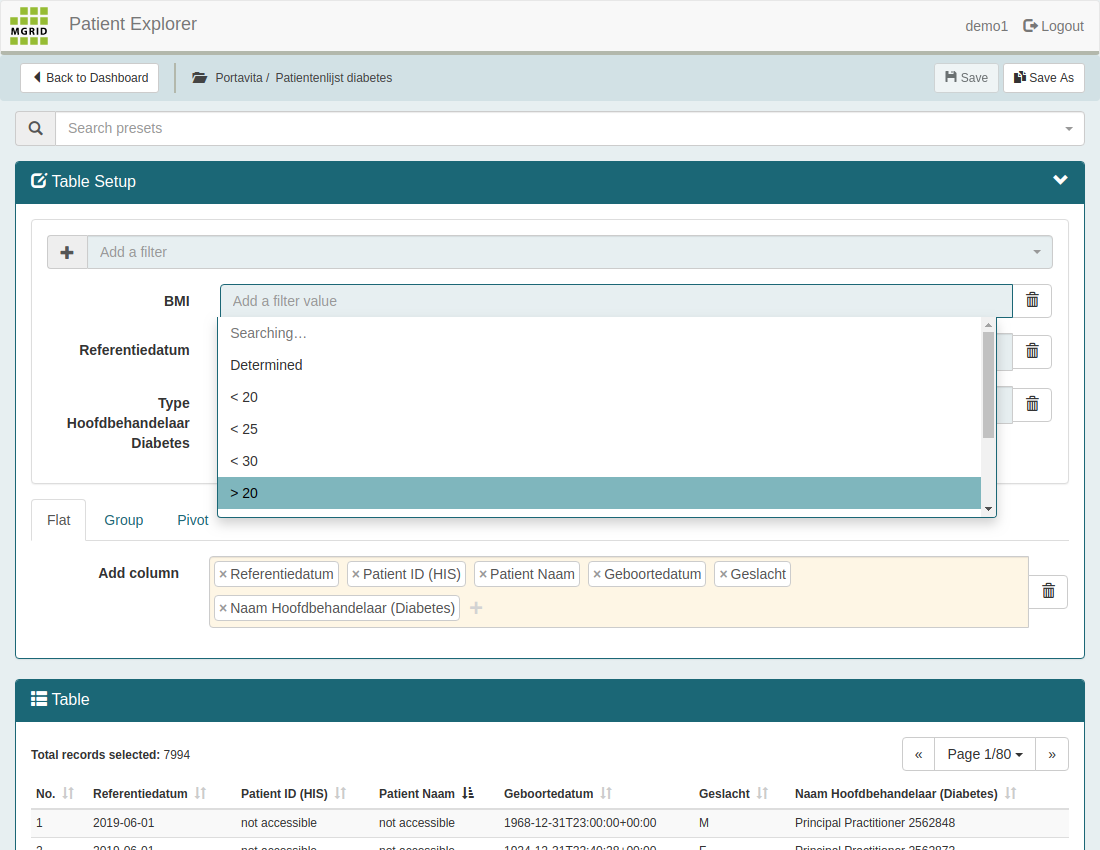 --- class: center, middle ### Add Filter (3/3) 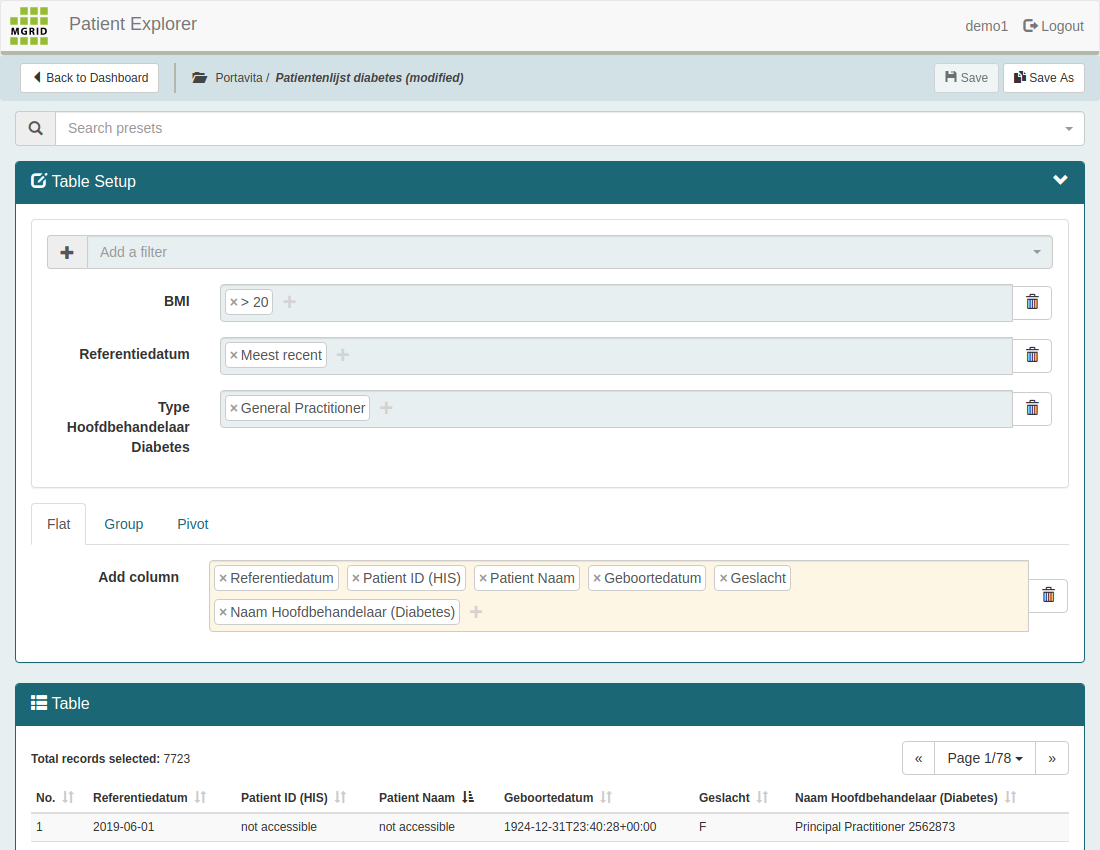 --- class: center, middle ### Save Preset 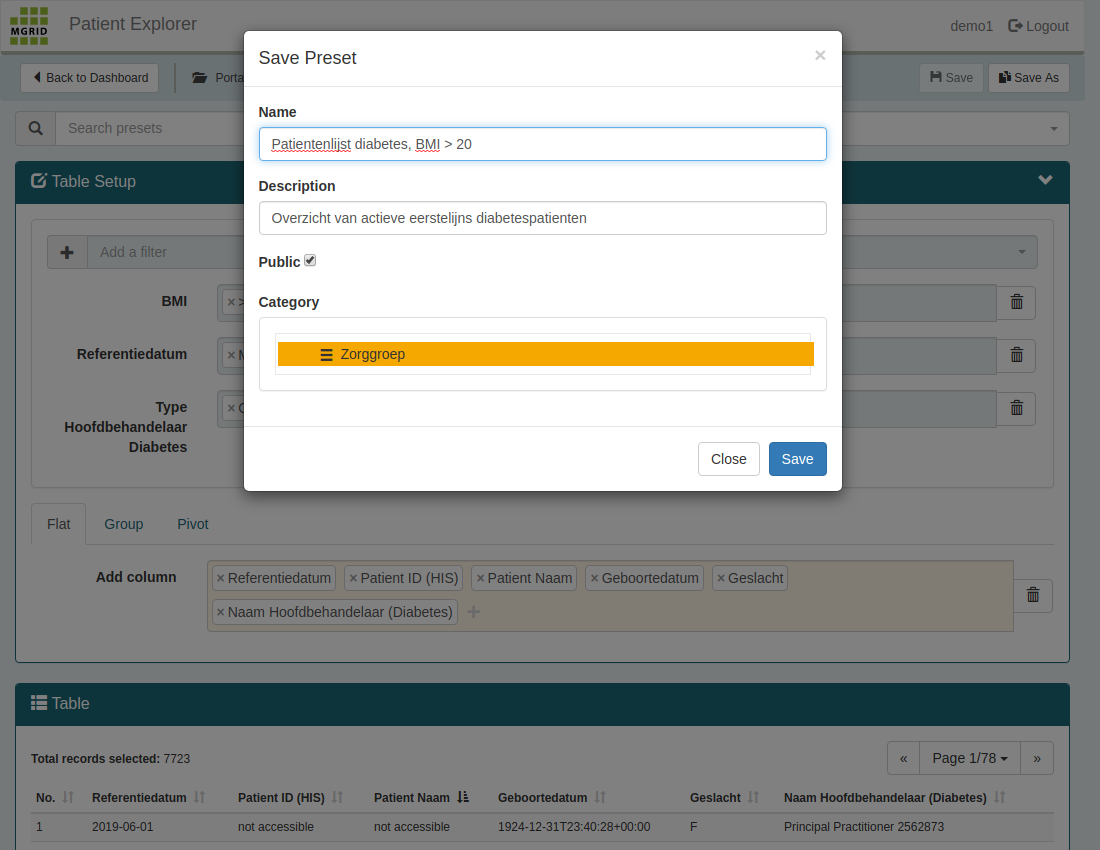 --- class: center, middle ### Search Preset 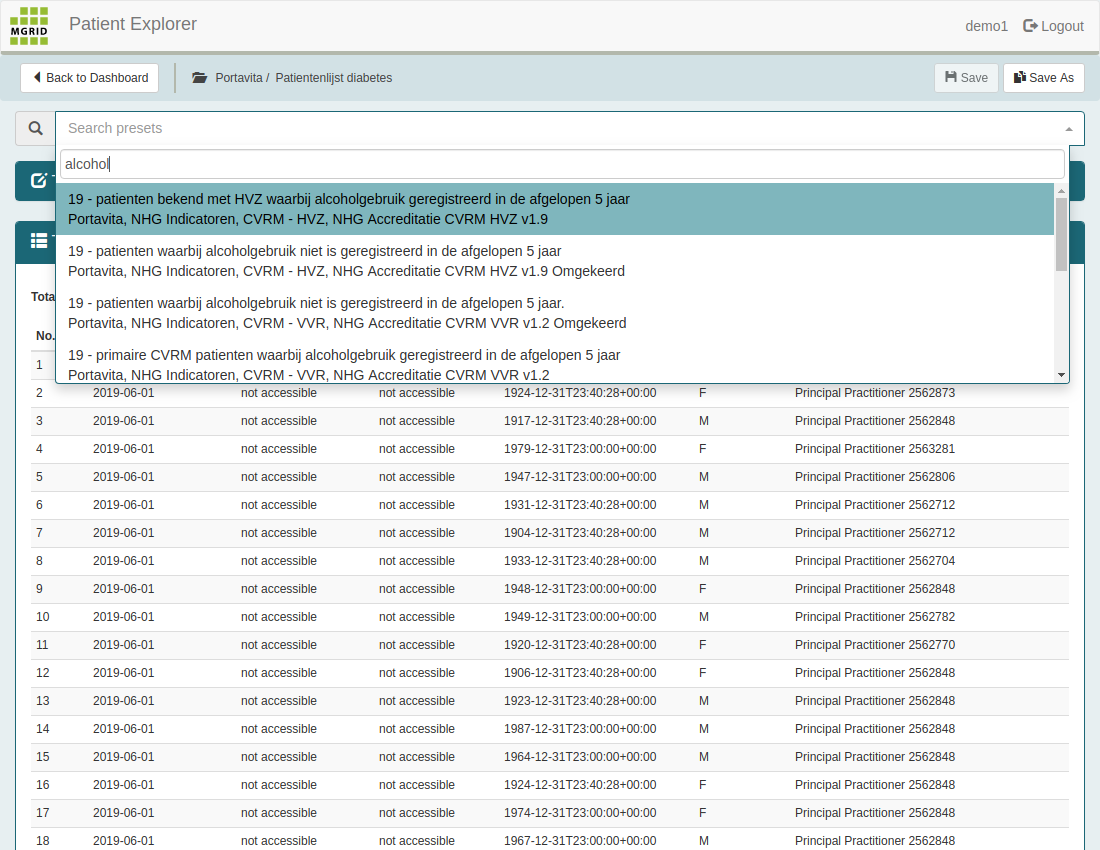 --- class: center, middle ### Group Data (1/2) 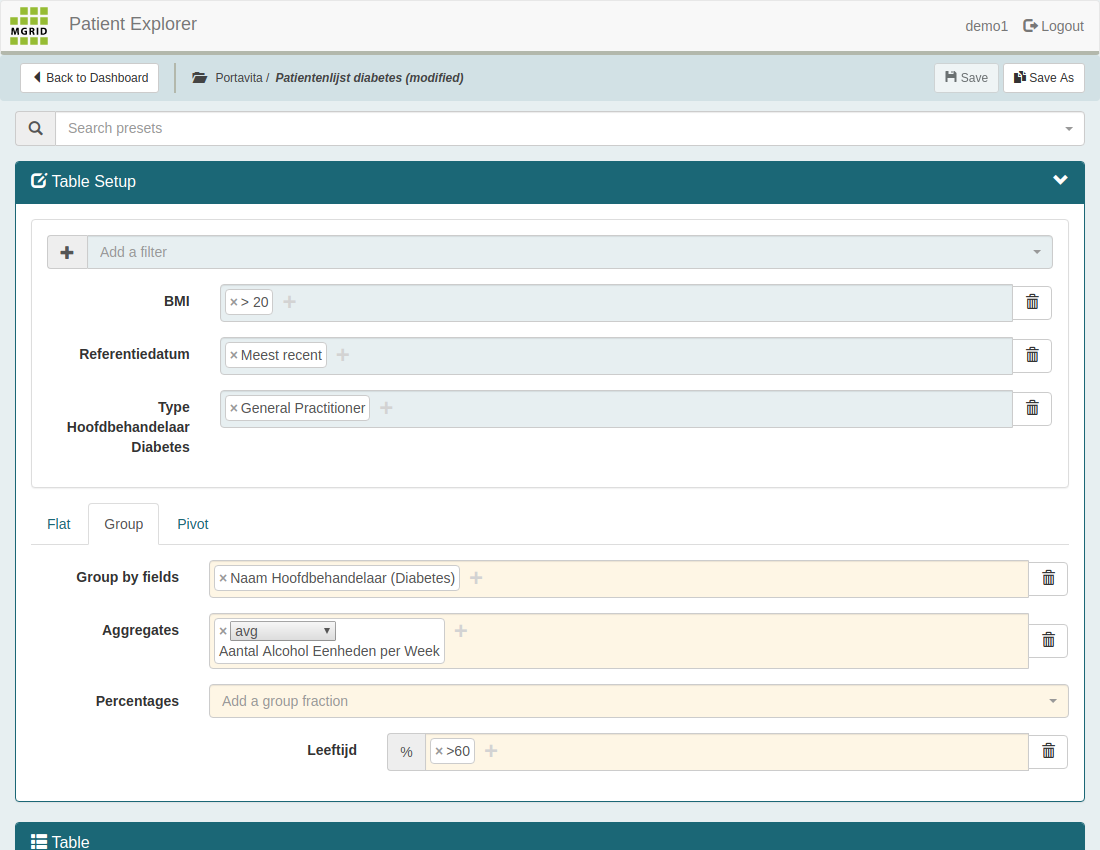 --- class: center, middle ### Group Data (2/2) 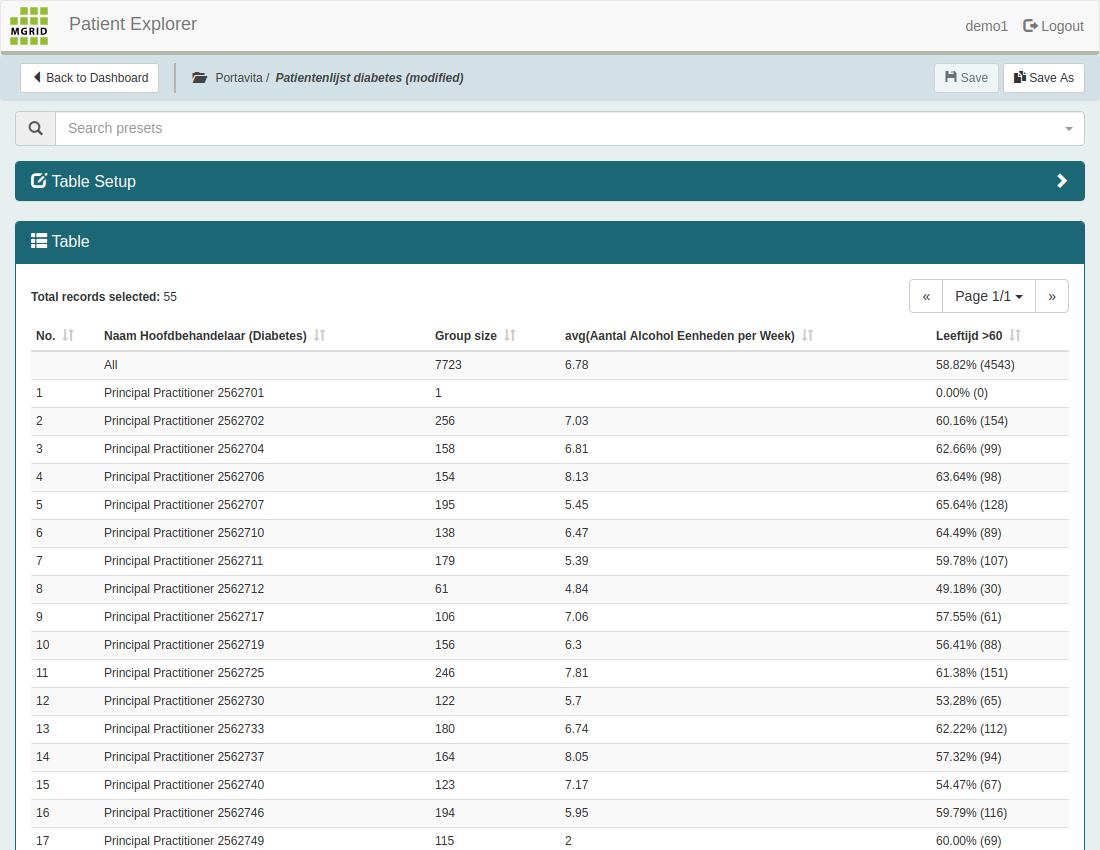 --- class: center, middle ### Pivot Data (1/4) 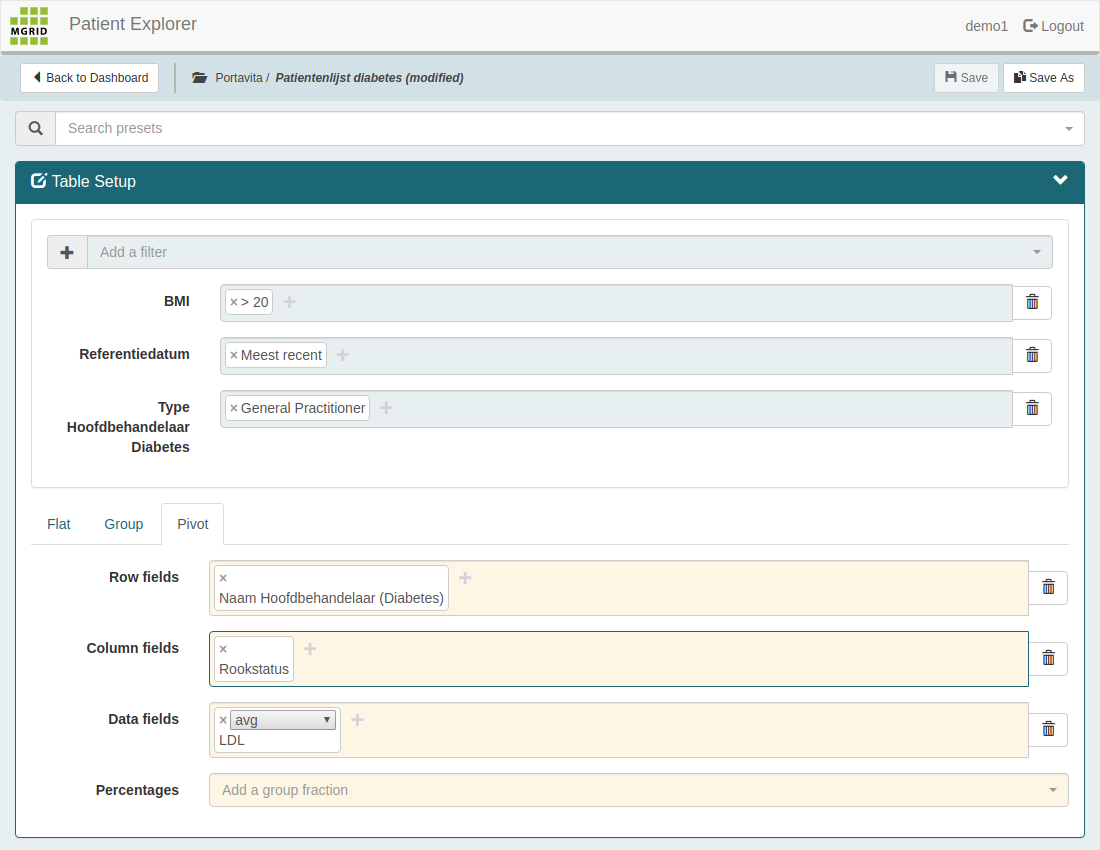 --- class: center, middle ### Pivot Data (2/4) 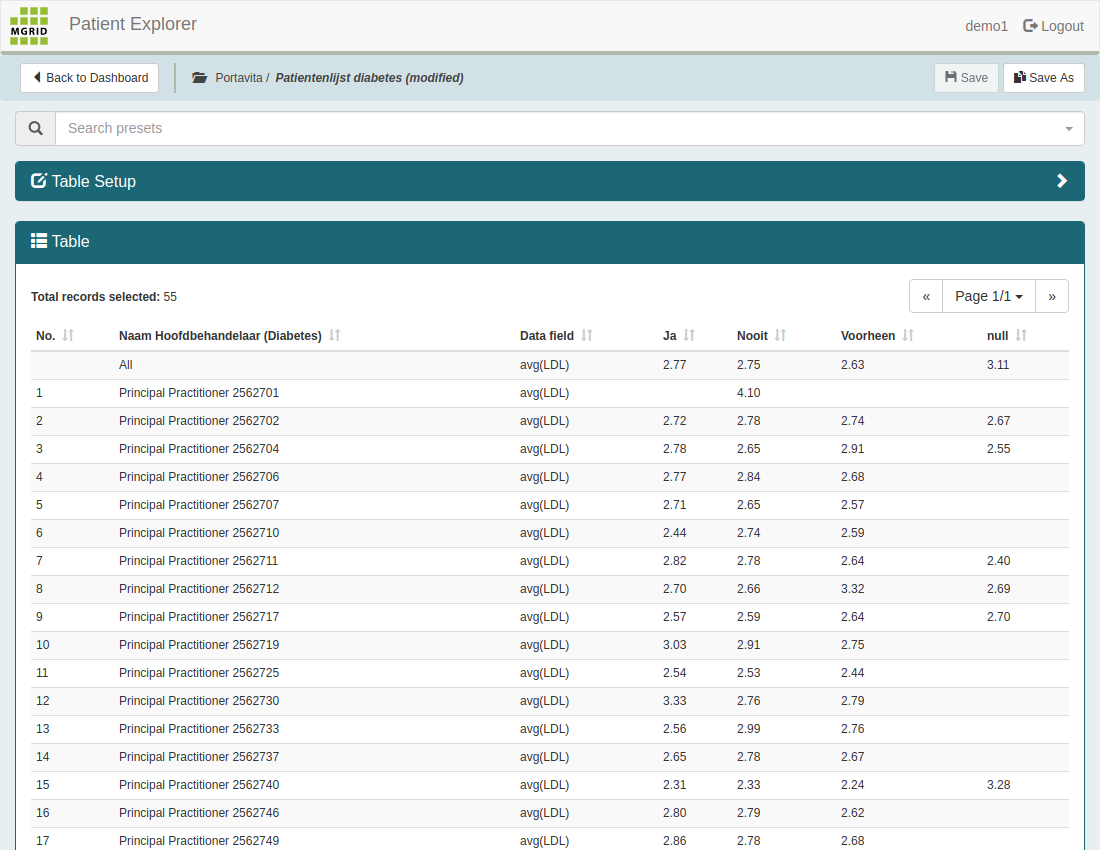 --- class: center, middle ### Pivot Data (3/4)  --- class: center, middle ### Pivot Data (4/4)  --- class: center, middle ### Questions or Demo Requests info@mgrid.net