3. Widgets
3.1. Introduction
The configuration of each widget is present in config_customer.yaml. The following table lists some of the common properties of widgets.
Property |
Mandatory |
Type |
Description |
|---|---|---|---|
appId |
optional |
string |
The Explorer instance to fetch data from. If not set, the default instance is used. |
area |
depends |
string |
The geo widget can be configured for a specific area to display, e.g. Germany. |
clickmap |
optional |
map |
Some widgets can redirect to an Explorer preset when the user clicks on (a specific part of) the widget.
Map must contain one key/value pair. The key refers to a Javascript function defined in DASHBOARD_FUNCTION_TEMPLATES.
This function is called with the base URL of Explorer as the first argument and the preset reference of the widget as the second argument.
It must return a map with presetref as key and the desired preset reference as the value, e.g. |
colors |
optional |
array/map |
Several widgets allow fixed or conditional colors to be set for lines and backgrounds. See specific widget for allowed values. |
content |
optional |
map |
Some widgets allow providing content or styling via this setting, e.g. the markdown, the presetlist and the text widget. |
datamap |
depends |
map |
Most widgets need this to map data from an Explorer preset to data that the widget understands.
Map must contain one key/value pair. The key refers to a Javascript function defined in DASHBOARD_FUNCTION_TEMPLATES.
This function is called with data from the Explorer preset as the first parameter. It must return a data structure
specific to the widget.
The value is also a map (possibly null) containing properties that can be used inside the function.
For example, if the value is |
highlightcolor |
optional |
string |
Some chart-like widgets allow setting a highlight color. This can be useful for highlighting a single value, e.g. to compare a single practice amongst its peers. This value defines the color. |
highlightmap |
optional |
map |
Some chart-like widgets allow setting a highlight color. This can be useful for highlighting a single value, e.g. to compare a single practice amongst its peers. Similar to datamap, there must be one key/value pair. |
labelmap |
depends |
map |
Most chart-like widgets need this to create labels that go with the data, e.g. the label ‘January’ has the value 15. Similar to datamap, there must be one key/value pair. |
options |
optional |
map |
Chart widgets are powered by the chartjs library. This options map is given directly to that library for styling of the chart,
e.g. |
parametermap |
optional |
map |
If parameters is set, this setting allows a function to be defined that alters the value(s) of the parameter widget.
This can be used for example to have a parameter year that feeds one widget and another widget that shows the previous year.
The latter widget then defines a function that subtracts one from the year parameter.
Map must contain one key/value pair. The key refers to a Javascript function defined in DASHBOARD_FUNCTION_TEMPLATES.
This function is called with the parameter value(s) as they are set at that moment.
It must return the same data-structure with the changed values, e.g. |
parameters |
optional |
array |
Data from a preset in Explorer can be filtered, e.g. to provide only values for the current year. Each item in this array should point to the identifier of a parameter widget. If that parameter is present on the dashboard and the user selects a value, that value is sent to Explorer to filter the data. |
presetref |
depends |
string |
The Explorer preset reference to fetch data from. Mandatory for most widgets. |
renderer |
mandatory |
string |
Renderer to use, e.g. chart, geo or wordcloud. |
rows |
depends |
array |
The textlist widget can be configured to display a list of text widgets. |
subtitle |
optional |
string |
Subtitle displayed on the widget. |
title |
mandatory |
string |
Title displayed on the widget. |
type |
depends |
string |
Some widget renderers need a type, e.g. the chart renderer has types bar and line. |
3.2. Bar
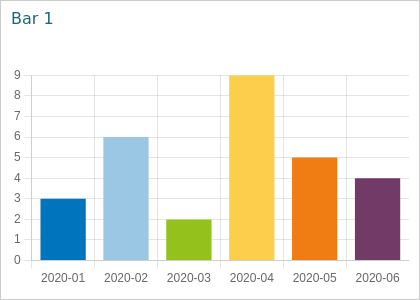
DASHBOARD_WIDGETS:
  bar1:
    title: Bar 1
    renderer: chart
    type: bar
    presetref: DUMMY
    colors: ["#0074bc", "#99c7e4", "#94c11c", "#fcce4c", "#ef7d14", "#723a66"]
    datamap: { bar1Data: null }
    labelmap: { bar1Labels: null }

DASHBOARD_FUNCTION_TEMPLATES:
  bar1Data: |
    function (data) {
      return [3, 6, 2, 9, 5, 4];
    }
  bar1Labels: |
    function (data) {
      return ["2020-01", "2020-02", "2020-03", "2020-04", "2020-05", "2020-06"];
    }
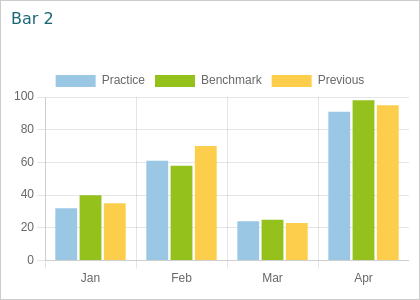
DASHBOARD_WIDGETS:
  bar2:
    title: Bar 2
    renderer: chart
    type: bar
    presetref: DUMMY
    colors: ["#99c7e4", "#94c11c", "#fcce4c"]
    datamap: { bar2Data: null }
    labelmap: { bar2Labels: null }

DASHBOARD_FUNCTION_TEMPLATES:
  bar2Data: |
    function (data) {
      return [[32, 61, 24, 91], [40, 58, 25, 98], [35, 70, 23, 95]];
    }
  bar2Labels: |
    function (data) {
      return [["Jan", "Feb", "Mar", "Apr"], ["Practice", "Benchmark", "Previous"]];
    }
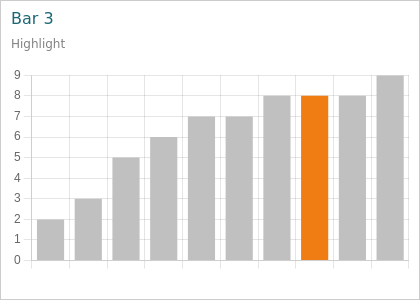
DASHBOARD_WIDGETS:
  bar3:
    title: Bar 3
    subtitle: Highlight
    renderer: chart
    type: bar
    presetref: DUMMY
    colors: ["#ef7d14"]
    datamap: { bar3Data: null }
    labelmap: { bar3Labels: null }
    highlightmap: { bar3Highlight: null }

DASHBOARD_FUNCTION_TEMPLATES:
  bar3Data: |
    function (data) {
      return [2, 3, 5, 6, 7, 7, 8, 8, 8, 9];
    }
  bar3Labels: |
    function (data) {
      return ["", "", "", "", "", "", "", "", "", ""];
    }
  bar3Highlight: |
    function (data, value, label) {
      return label == 7;
    }
3.3. Doughnut
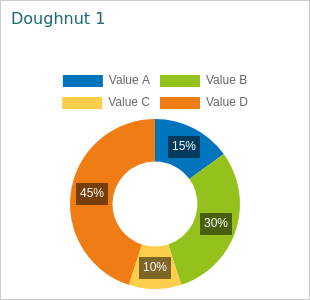
DASHBOARD_WIDGETS:
  doughnut1:
    title: Doughnut 1
    renderer: chart
    type: doughnut
    presetref: DUMMY
    colors: ["#0074bc", "#94c11c", "#fcce4c", "#ef7d14"]
    datamap: { doughnut1Data: null }
    labelmap: { doughnut1Labels: null }

DASHBOARD_FUNCTION_TEMPLATES:
  doughnut1Data: |
    function (data) {
      return [3, 6, 2, 9];
    }
  doughnut1Labels: |
    function (data) {
      return ["Value A", "Value B", "Value C", "Value D"];
    }
3.4. Feedbacklist

DASHBOARD_WIDGETS:
  feedbacklist1:
    title: Feedbacklist 1
    subtitle: Lorem ipsum
    renderer: feedbacklist
    presetref: DUMMY
    colors: { 6: ["#eb4c56", "#ffffff"], 8: ["#f4a35a", "#333333"], 9: ["#fcce4c", "#333333"], 11: ["#4c9dd0", "#ffffff"] }
    datamap: { feedbacklist1Data: null }
    clickmap: { presetRef: { ref: "FEEDBACK" } }

DASHBOARD_FUNCTION_TEMPLATES:
  feedbacklist1Data: |
    function (data) {
      return [
        [9.4, "Martine Slechteren", "Bekwaam en deskundig. Duidelijke uitleg.", "Gaat super!", "Geen verbeterpunten"],
        [8.1, "Bas de Goede", "Was gewoon goed.", "Goed bezig", "Lagere kosten"],
        [6.3, "Anoniem", "Vond de communicatie niet zo goed.", "Behandeling goed", "Beter communiceren"]
      ];
    }
3.5. Gauge
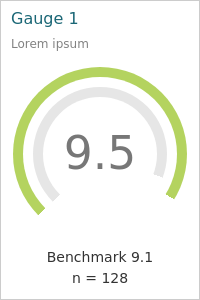
DASHBOARD_WIDGETS:
  gauge1:
    title: Gauge 1
    subtitle: Lorem ipsum
    renderer: gauge
    presetref: DUMMY
    colors: { "below": "#eb4c56", "above": "#b4d35f" }
    datamap: { gauge1Data: null }

DASHBOARD_FUNCTION_TEMPLATES:
  gauge1Data: |
    function (data) {
      return [
        95, 91, 9.5, ["Benchmark 9.1", "n = 128"]
      ];
    }
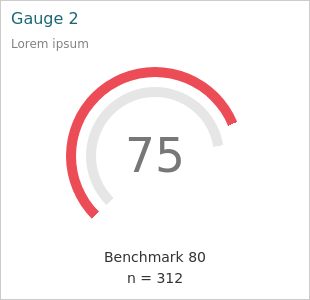
DASHBOARD_WIDGETS:
  gauge2:
    title: Gauge 2
    subtitle: Lorem ipsum
    renderer: gauge
    presetref: DUMMY
    colors: { "below": "#eb4c56", "above": "#b4d35f" }
    datamap: { gauge2Data: null }

DASHBOARD_FUNCTION_TEMPLATES:
  gauge2Data: |
    function (data) {
      return [
        75, 80, 75, ["Benchmark 80", "n = 312"]
      ];
    }
3.6. Geo
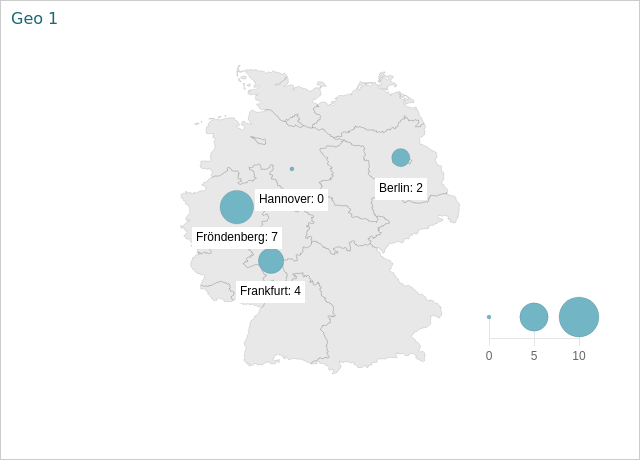
DASHBOARD_WIDGETS:
  geo1:
    title: Geo 1
    renderer: geo
    area: Germany
    presetref: DUMMY
    datamap: { geo1Data: null }
    labelmap: { geo1Labels: null }

DASHBOARD_FUNCTION_TEMPLATES:
  geo1Data: |
    function (data) {
      return [2, 4, 7, 0];
    }
  geo1Labels: |
    function (data) {
      return [
        ["Berlin", 52.520007, 13.404954],
        ["Frankfurt", 50.110922, 8.682127],
        ["Fröndenberg", 51.473981, 7.768603],
        ["Hannover", 52.375892, 9.732010],
      ];
    }
3.7. Itemlist

DASHBOARD_WIDGETS:
  itemlist1:
    title: Itemlist 1
    subtitle: Lorem ipsum
    renderer: itemlist
    presetref: DUMMY
    colors: { 10: ["#4c9dd0", "#ffffff"], 20: ["#fcce4c", "#333333"], 40: ["#f4a35a", "#333333"], 999999: ["#eb4c56", "#ffffff"] }
    datamap: { itemlist1Data: null }

DASHBOARD_FUNCTION_TEMPLATES:
  itemlist1Data: |
    function (data) {
      return [
        ["bi-folder", "Files closed too late", "Treatment took place more than 60 days ago", 40],
        ["bi-envelope-x", "Incorrect email address", "No (valid) email address entered", 20],
        ["bi-person-exclamation", "Unknown practitioner", "Practitioner is not activated", 5]
      ];
    }
3.8. Line
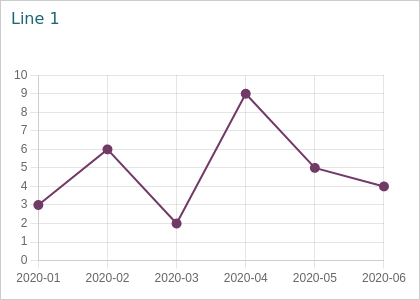
DASHBOARD_WIDGETS:
  line1:
    title: Line 1
    renderer: chart
    type: line
    presetref: DUMMY
    colors: ["#723a66"]
    options: { "scales": { "y": { "min": 0, "max": 10 } } }
    datamap: { line1Data: null }
    labelmap: { line1Labels: null }

DASHBOARD_FUNCTION_TEMPLATES:
  line1Data: |
    function (data) {
      return [3, 6, 2, 9, 5, 4];
    }
  line1Labels: |
    function (data) {
      return ["2020-01", "2020-02", "2020-03", "2020-04", "2020-05", "2020-06"];
    }
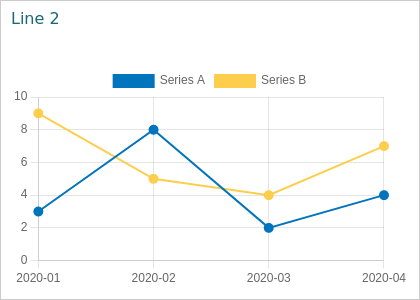
DASHBOARD_WIDGETS:
  line2:
    title: Line 2
    renderer: chart
    type: line
    presetref: DUMMY
    colors: ["#0074bc", "#fcce4c"]
    options: { "scales": { "y": { "min": 0, "max": 10 } } }
    datamap: { line2Data: null }
    labelmap: { line2Labels: null }

DASHBOARD_FUNCTION_TEMPLATES:
  line2Data: |
    function (data) {
      return [[3, 8, 2, 4], [9, 5, 4, 7]];
    }
  line2Labels: |
    function (data) {
      return [["2020-01", "2020-02", "2020-03", "2020-04"], ["Series A", "Series B"]];
    }
3.9. Markdown
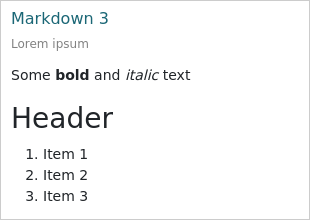
DASHBOARD_WIDGETS:
  markdown3:
    title: Markdown 3
    subtitle: Lorem ipsum
    renderer: markdown
    content:
      markdown: |
        Some **bold** and *italic* text

        ### Header

        1. Item 1
        1. Item 2
        1. Item 3
3.10. Percentage
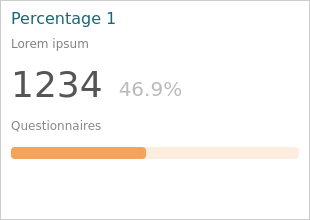
DASHBOARD_WIDGETS:
  percentage1:
    title: Percentage 1
    subtitle: Lorem ipsum
    renderer: percentage
    presetref: DUMMY
    colors: { 25: "#eb4c56", 50: "#f4a35a", 75: "#fcce4c", 101: "#4c9dd0" }
    datamap: { percentage1Data: null }

DASHBOARD_FUNCTION_TEMPLATES:
  percentage1Data: |
    function (data) {
      return [
        1234,
        46.9,
        "Questionnaires"
      ];
    }
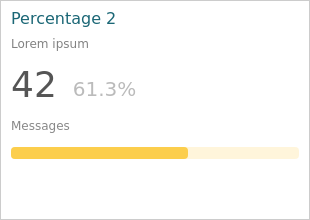
DASHBOARD_WIDGETS:
  percentage2:
    title: Percentage 2
    subtitle: Lorem ipsum
    renderer: percentage
    presetref: DUMMY
    colors: { 25: "#eb4c56", 50: "#f4a35a", 75: "#fcce4c", 101: "#4c9dd0" }
    datamap: { percentage2Data: null }

DASHBOARD_FUNCTION_TEMPLATES:
  percentage2Data: |
    function (data) {
      return [
        42,
        61.3,
        "Messages"
      ];
    }
3.11. Presetlist
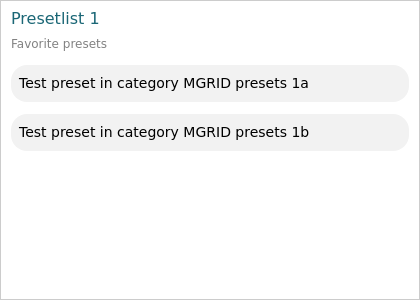
DASHBOARD_WIDGETS:
  presetlist1:
    title: Presetlist 1
    subtitle: Favorite presets
    renderer: presetlist
    content: { "exp2": ["PREF_3", "PREF_4"] }
3.12. Sankey
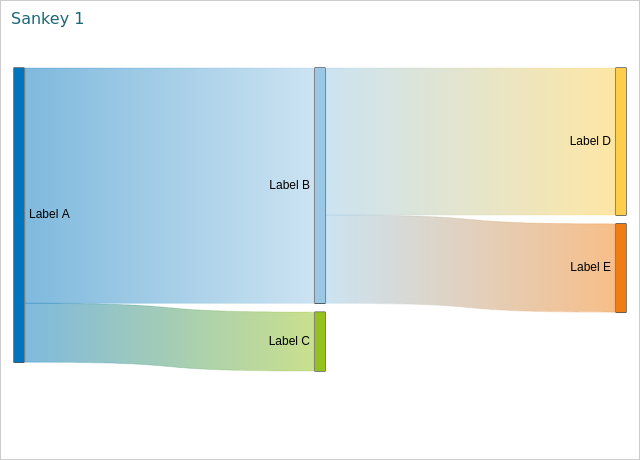
DASHBOARD_WIDGETS:
  sankey1:
    title: Sankey 1
    renderer: sankey
    presetref: DUMMY
    datamap: { sankey1Data: null }
    labelmap: { sankey1Labels: null }
    colors: ["#0074bc", "#99c7e4", "#94c11c", "#fcce4c", "#ef7d14"]
    options:
      column:
        "a": 0
        "b": 1
        "c": 1
        "d": 2
        "e": 2
      priority:
        "a": 1
        "b": 2
        "c": 3
        "d": 4
        "e": 5

DASHBOARD_FUNCTION_TEMPLATES:
  sankey1Data: |
    function(data) {
      return [
        {from: "a", to: "b", flow: 80},
        {from: "a", to: "c", flow: 20},
        {from: "b", to: "d", flow: 50},
        {from: "b", to: "e", flow: 30},
      ];
    }
  sankey1Labels: |
    function (data) {
      return {
        a: "Label A",
        b: "Label B",
        c: "Label C",
        d: "Label D",
        e: "Label E"
      };
    }
3.13. Scatter
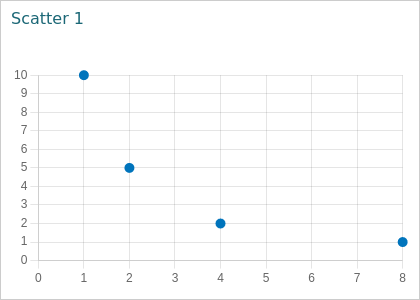
DASHBOARD_WIDGETS:
  scatter1:
    title: Scatter 1
    renderer: chart
    type: scatter
    presetref: DUMMY
    datamap: { scatter1Data: null }

DASHBOARD_FUNCTION_TEMPLATES:
  scatter1Data: |
    function (data) {
      return [
        { x: 1, y: 10 },
        { x: 2, y: 5 },
        { x: 4, y: 2 },
        { x: 8, y: 1 }
      ];
    }
3.14. StackedBar
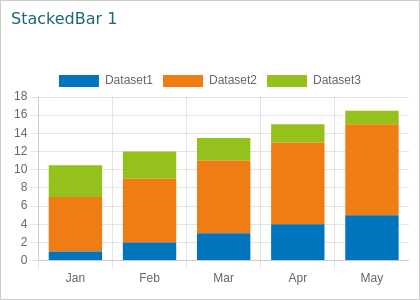
DASHBOARD_WIDGETS:
  stackedbar1:
    title: StackedBar 1
    renderer: chart
    type: stackedBar
    presetref: DUMMY
    datamap: { stackedbar1Data: null }
    labelmap: { stackedbar1Labels: null }

DASHBOARD_FUNCTION_TEMPLATES:
  stackedbar1Data: |
    function (data) {
      return [[1, 2, 3, 4, 5], [6, 7, 8, 9, 10], [3.5, 3.0, 2.5, 2.0, 1.5]];
    }
  stackedbar1Labels: |
    function (data) {
      return [["Jan", "Feb", "Mar", "Apr", "May"], ["Dataset1", "Dataset2", "Dataset3"]];
    }
3.15. Table
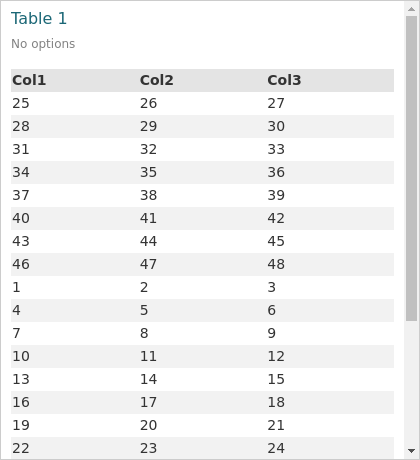
DASHBOARD_WIDGETS:
  table1:
    title: Table 1
    subtitle: No options
    renderer: table
    presetref: DUMMY
    datamap: { tableData: null }
    labelmap: { tableLabels: null }

DASHBOARD_FUNCTION_TEMPLATES:
  tableData: |
    function (data) {
      return [[25, 26, 27], [28, 29, 30], [31, 32, 33], [34, 35, 36], [37, 38, 39], [40, 41, 42], [43, 44, 45], [46, 47, 48],
              [1, 2, 3], [4, 5, 6], [7, 8, 9], [10, 11, 12], [13, 14, 15], [16, 17, 18], [19, 20, 21], [22, 23, 24],
              [49, 50, 51], [52, 53, 54], [55, 56, 57], [58, 59, 60], [61, 62, 63], [64, 65, 66], [67, 68, 69], [70, 71, 72]];
    }
  tableLabels: |
    function (data) {
      return ["Col1", "Col2", "Col3"];
    }
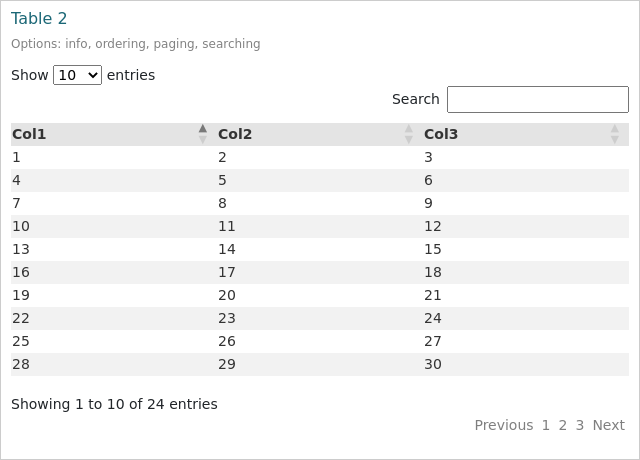
DASHBOARD_WIDGETS:
  table2:
    title: Table 2
    subtitle: "Options: info, ordering, paging, searching"
    renderer: table
    options:
      { "info": True, "ordering": True, "paging": True, "searching": True }
    presetref: DUMMY
    datamap: { tableData: null }
    labelmap: { tableLabels: null }

DASHBOARD_FUNCTION_TEMPLATES:
  tableData: |
    function (data) {
      return [[25, 26, 27], [28, 29, 30], [31, 32, 33], [34, 35, 36], [37, 38, 39], [40, 41, 42], [43, 44, 45], [46, 47, 48],
              [1, 2, 3], [4, 5, 6], [7, 8, 9], [10, 11, 12], [13, 14, 15], [16, 17, 18], [19, 20, 21], [22, 23, 24],
              [49, 50, 51], [52, 53, 54], [55, 56, 57], [58, 59, 60], [61, 62, 63], [64, 65, 66], [67, 68, 69], [70, 71, 72]];
    }
  tableLabels: |
    function (data) {
      return ["Col1", "Col2", "Col3"];
    }
3.16. Text
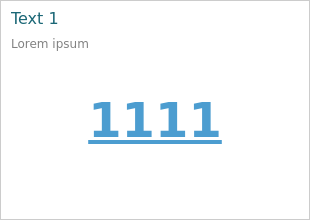
DASHBOARD_WIDGETS:
  text1:
    title: Text 1
    subtitle: Lorem ipsum
    renderer: text
    presetref: DUMMY
    content:
      {
        "color": "#4c9dd0",
        "size": "48",
        "bold": true,
        "italic": false,
        "underline": true,
      }
    datamap: { text1Data: null }

DASHBOARD_FUNCTION_TEMPLATES:
  text1Data: |
    function (data) {
      return ["1111"];
    }
3.17. Textlist
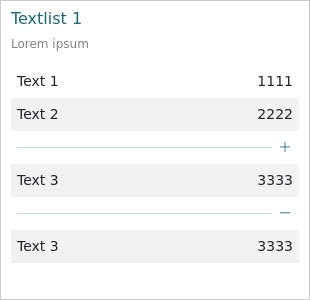
DASHBOARD_WIDGETS:
  textlist1:
    title: Textlist 1
    subtitle: Lorem ipsum
    renderer: textlist
    rows:
      - { id: "text1" }
      - { id: "text2" }
      - { line_plus: "yes" }
      - { id: "text3" }
      - { line_minus: "yes" }
      - { id: "text3" }
3.18. Tree
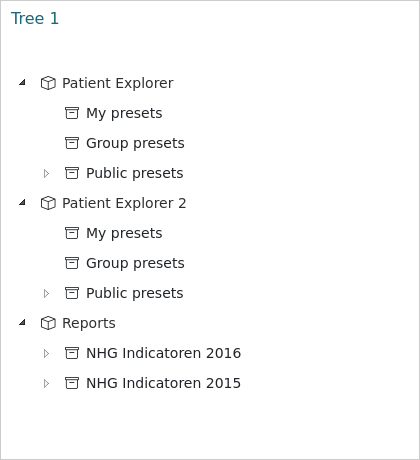
DASHBOARD_WIDGETS:
  tree1:
    title: Tree 1
    renderer: tree
3.19. Wordcloud

DASHBOARD_WIDGETS:
  wordcloud1:
    title: Wordcloud 1
    renderer: wordcloud
    presetref: DUMMY
    datamap: { wordcloud1Data: null }

DASHBOARD_FUNCTION_TEMPLATES:
  wordcloud1Data: |
    function (data) {
      return [
        ["Hello", "World", "Cloud", "Test1", "Test2", "Test3", "Test4", "Test5"],
        [50, 30, 20, 50, 30, 20, 40, 15],
        ["#FC9039", "#72B5C5", "#812A00", "#1B6776", "#91705A", "#63BAAB"]
      ];
    }